The network for creativity
Join 1.25M professional creatives like you
Connect with clients, get discovered, and run your business 100% commission-free
Creatives on Contra have earned over $150M and we are just getting started
Back to feedPost

Title: From Sales Metrics to Cash Flow: Financial Model for a Volatile-Revenue Business
Description:
Built an integrated cash flow and P&L model driven by commercial metrics — sales volume, average ticket size, and customer base growth — rather than pre-aggregated financial figures, for a business with uneven or seasonal revenue.
Challenge: The company could see sales and customer numbers, but had no clear view of how much cash that would actually generate, or when — leaving liquidity planning largely reactive.
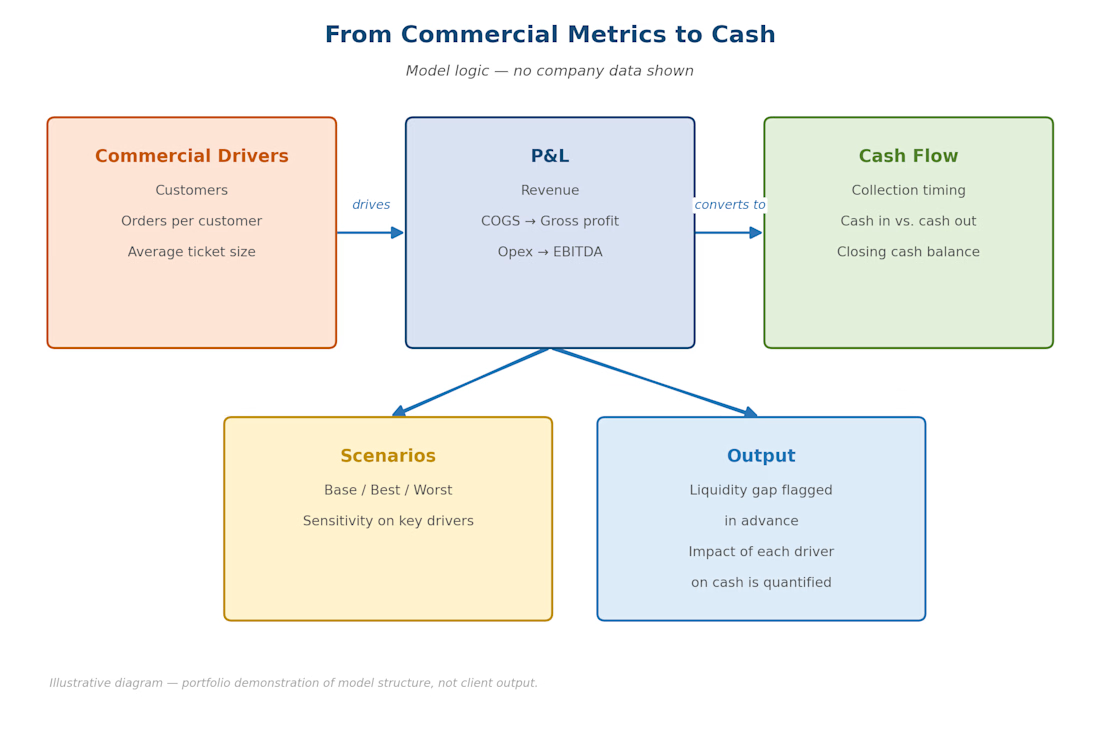
Approach: Commercial drivers flow through three linked layers — Commercial Metrics → P&L → Cash Flow — entirely on live formulas, so the model recalculates end-to-end when any input changes. Cash conversion is modeled with a collection-lag assumption (a share of revenue collected the same month, the rest the following month), which is what actually creates the liquidity gap between "profitable" and "cash-positive."
What it surfaced (illustrative figures): In the sample run, EBITDA turned positive by month 3, but the cash balance still dipped to a low point before recovering two months later — the gap between accounting profit and available cash that the business needed to plan around. Every driver (orders per customer, ticket size, collection speed) is a single editable input, so the same model reruns instantly for a different scenario.
Outcome: Turned a sales question into a cash planning answer, with the exact month and depth of the liquidity gap visible in advance instead of discovered after the fact.

The network for creativity
Join 1.25M professional creatives like you
Connect with clients, get discovered, and run your business 100% commission-free
Creatives on Contra have earned over $150M and we are just getting started







Related posts

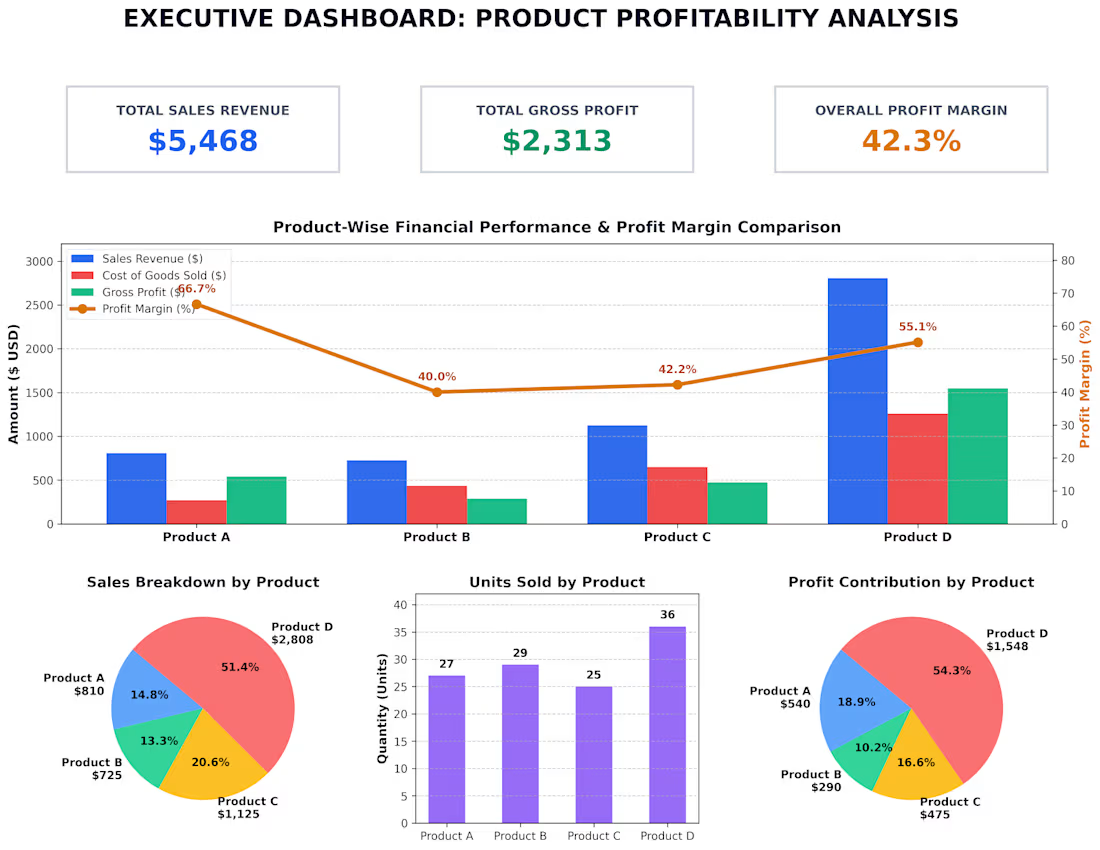
Dashboard Key Highlights:
Total Performance: Total Revenue of $5,468 and Gross Profit of $2,313 with an overall profit margin of 42.3%.
Top Profit Contributor: Product D yields the highest gross profit at $1,548 (54.3% of total profit) and revenue of $2,808 (51.4% of total sales).
Highest Margin Product: Product A leads in efficiency with a 66.7% profit margin ($540 profit on $810 sales).


PROFESSIONAL SUMMARY
Data-driven professional with strong expertise in Data Analysis, Excel, and SQL. Proficient in building data dashboards, performing complex data cleaning, and deriving actionable business insights. Demonstrated ability to work with large datasets (1400+ records) and create comprehensive analytics solutions. Seeking part-time opportunities to leverage analytical skills while expanding expertise in data-driven decision-making.
TECHNICAL SKILLS
Data Analysis & Visualization: Excel (Advanced), SQL (Intermediate), Data Cleaning, Data Modeling
Excel Expertise: Advanced formulas, VLOOKUP, Pivot Tables, Dashboards, Data Validation, Conditional Formatting
SQL Skills: Query writing, Data extraction, Database analysis
Programming: Python (Basic).
Project Links :


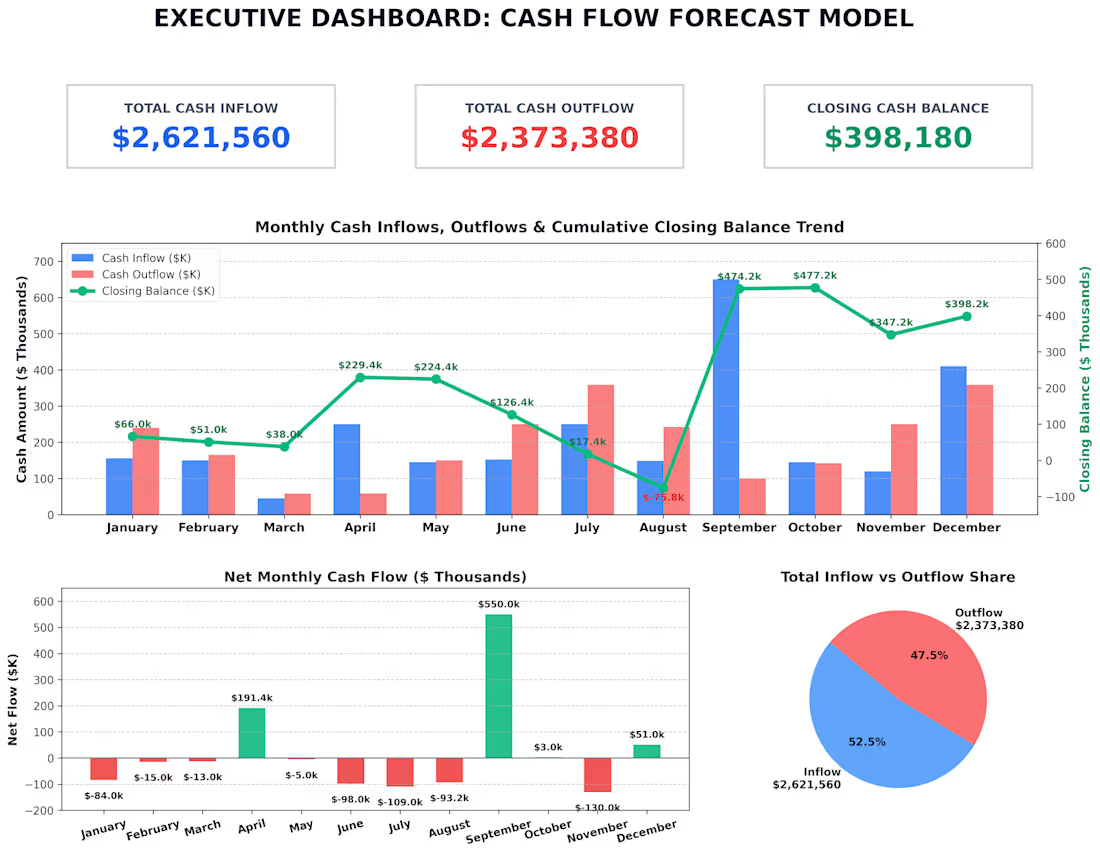
(Cash Flow Forecast Model & Executive Dashboard) is a financial liquidity and cash management reporting framework designed to evaluate an organization's monthly cash position across a 12-month operating cycle. The project transforms raw financial transaction data—comprising opening balances, cash inflows, and cash outflows—into an interactive visual dashboard.
Key Outcomes & Achievements
Liquidity & Deficit Risk Tracking: Formulated a rolling cash flow tracking model that successfully pinpointed critical cash-burn periods. The analysis identified an August deficit of -$75,820 caused by consecutive peak outflow months (July: $359,000; August: $241,780), enabling advance visibility into working capital shortfalls.
Cash Flow Variance & Recovery Modeling: Analyzed monthly net cash flow fluctuations to measure solvency recovery. Identified a +$550,000 net cash surplus in September that replenished cash reserves and restored liquidity to $474,180.
Annual Solvency Performance: Conducted full-year aggregation showing $2,621,560 in total cash inflows against $2,373,380 in total outflows. This verified a positive annual net cash flow of +$248,180 and an ending cash balance of $398,180.
Executive Visualization & Reporting: Engineered a modern multi-panel dashboard incorporating dynamic KPI callouts, twin-axis trendlines for cumulative balances, and color-coded net cash flow indicators to facilitate rapid decision-making for corporate finance leadership.
Technical Tools & Methodologies Used
Data Processing & Analytics: Python for loading, auditing, and processing complex financial time-series data from Microsoft Excel
Financial Visualization Engineering: matplotlib and matplotlib.gridspec to construct custom, executive-ready dashboard layouts featuring dual-y axis overlays, grouped bar charts, and proportion visuals.
Layout Design & Quality Control: PIL (Pillow) to verify high-resolution output rendering, pixel alignment, and typography hierarchy across visual elements.