The network for creativity
Join 1.25M professional creatives like you
Connect with clients, get discovered, and run your business 100% commission-free
Creatives on Contra have earned over $150M and we are just getting started
Back to feedPost
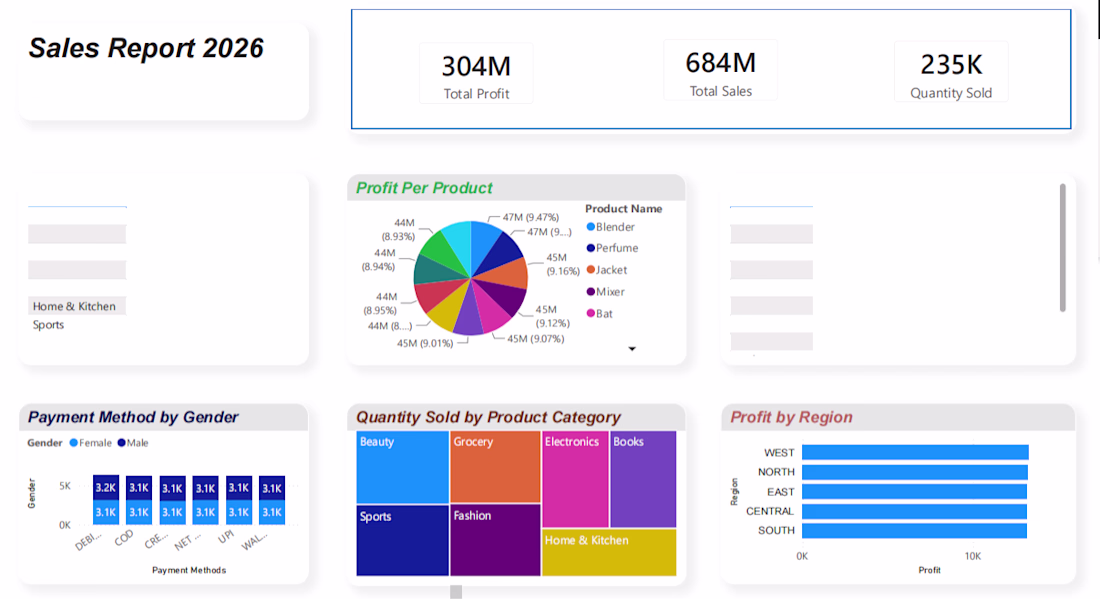
End-to-End Sales Analytics & Interactive BI Dashboard
Developed a comprehensive data pipeline to clean, structure, and visualize complex transactional data. This interactive dashboard tracks critical business metrics across regions, categories, and payment types—transforming raw data into actionable insights to monitor high-volume performance like $684M in Total Sales and $304M in Net Profit.
Tools Used:
• Data Analytics & Visualization: Power BI, Microsoft Excel
• Database Management: SQL
• Programming & Core Libraries: Python, Pandas, NumPy
• Automation: Custom Python ETL scripting for speed and efficiency
The network for creativity
Join 1.25M professional creatives like you
Connect with clients, get discovered, and run your business 100% commission-free
Creatives on Contra have earned over $150M and we are just getting started
Related posts
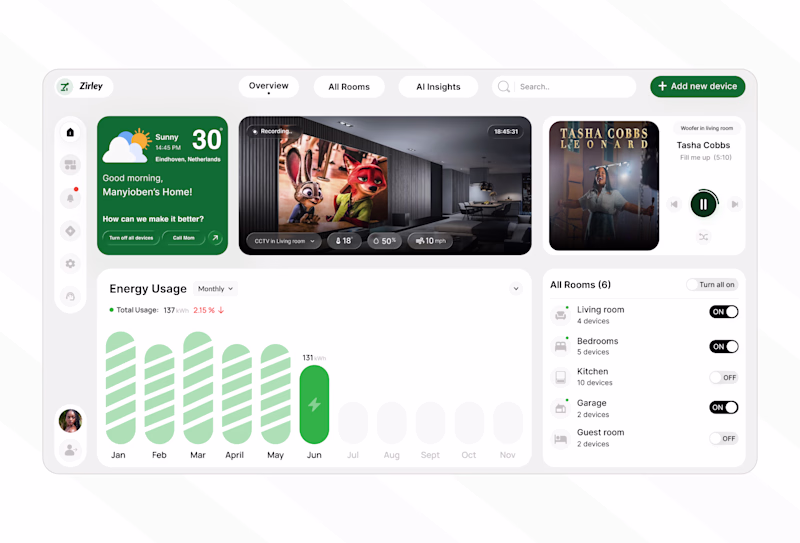
Nyeles Sales Analytics Dashboard | UI Exploration
A concept UI for sales teams and founders who want quick, reliable insights into how their business is performing, without feeling overwhelmed by the data.
Key screens cover a customizable widget dashboard with live KPIs, monthly revenue and deal tracking, geographic market analysis by country, customer online vs offline breakdown, and a time visit heatmap.
Have a project? Let's collaborate! https://cal.com/orenji-studio/30min?overlayCalendar=true
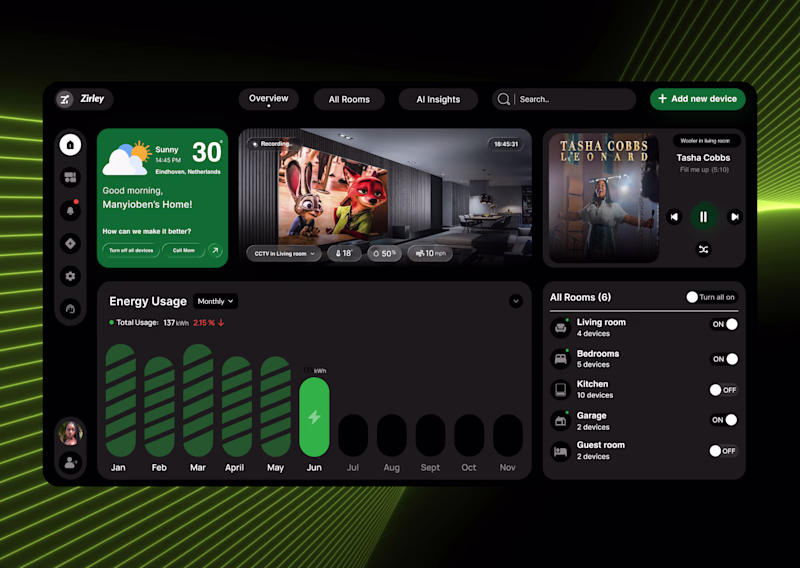
Dark mode is better
Nice work
Trending
Claude
Claude has entered the design space. How are you using Claude Design?
Contra University
Learn from expert creatives how to earn more using next-gen AI tools.
MagicPath
The canvas is infinite, and exploration is becoming the workflow. How are you using MagicPath?
creativeaiflow
Creative AI workflows are evolving. What tools do you use, and what are their strengths and weaknesses?
freelancerlife
Freelancer life is wins, pivots, and everything in between. What’s yours right now?