The network for creativity
Join 1.25M professional creatives like you
Connect with clients, get discovered, and run your business 100% commission-free
Creatives on Contra have earned over $150M and we are just getting started
Back to feedPost

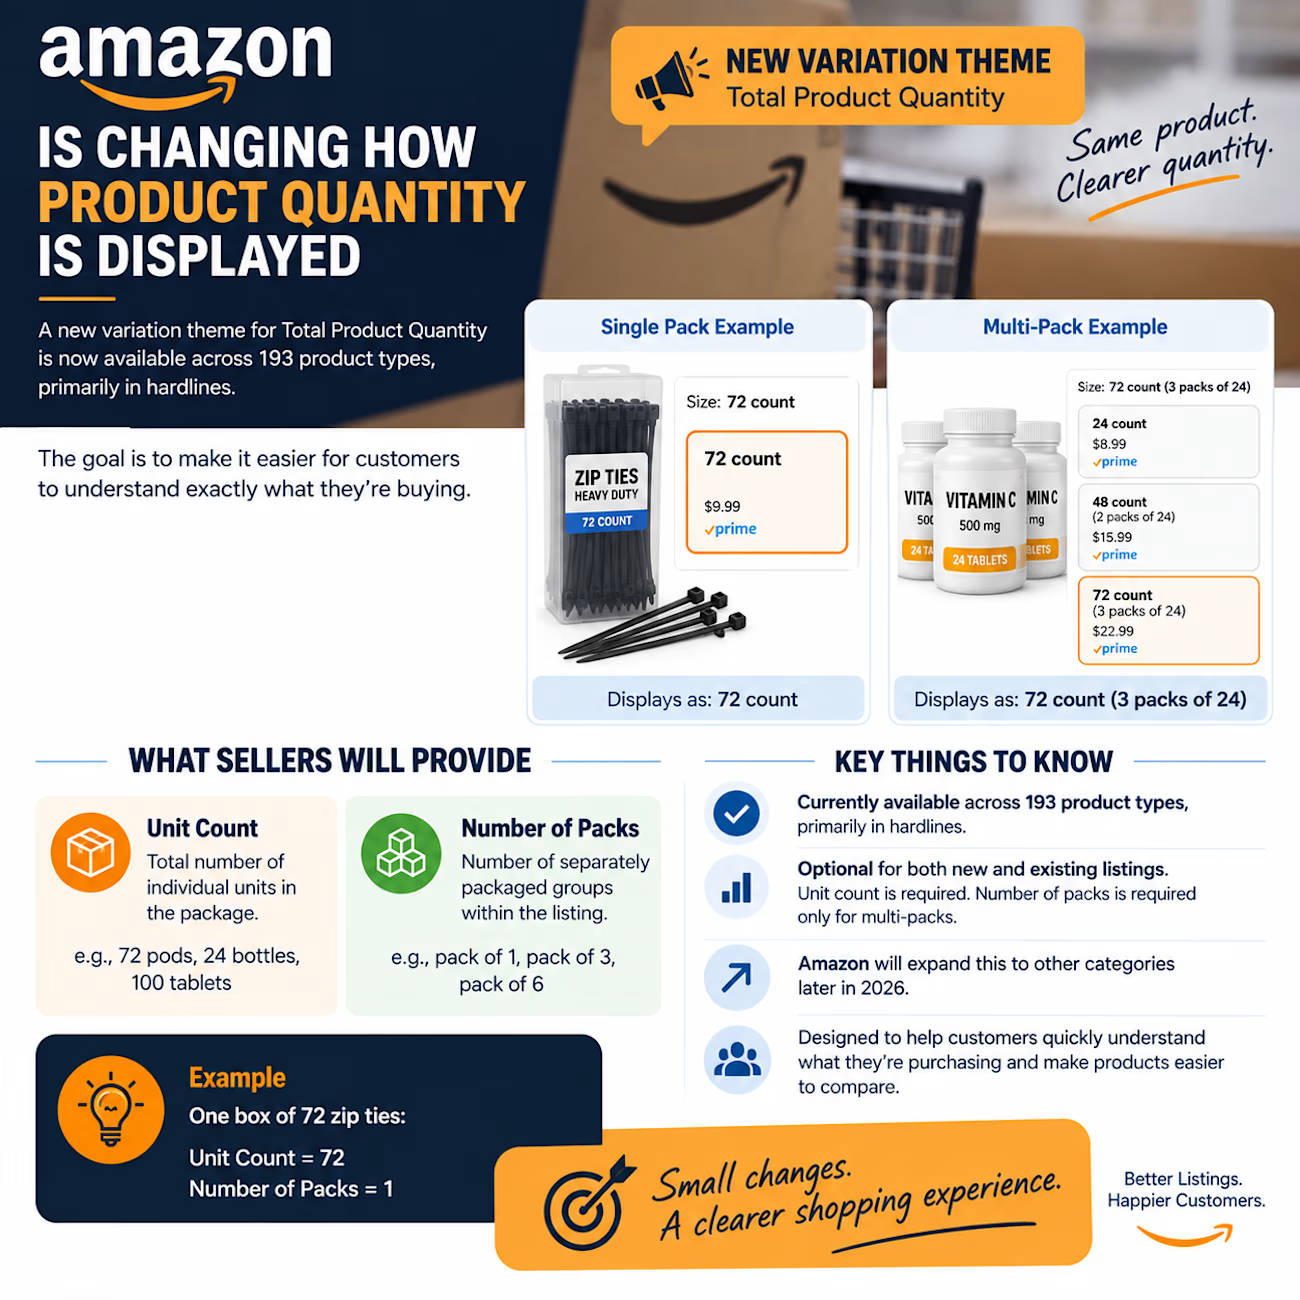
Amazon is changing the way product quantity is displayed.
And if you sell products with different pack sizes, this is worth paying attention to.
Amazon has launched a new Total Product Quantity variation theme across 193 product types, primarily in hardlines.
The idea is to make quantity much easier for customers to understand.
For example:
Single pack:
72 count
Multi-pack:
72 count (3 packs of 24)
Instead of mixing quantity with attributes like size or color, Amazon is separating it into its own standardized format.
Sellers will provide:
→ Unit Count — total number of individual units
→ Number of Packs — how many separately packaged groups are included
For example:
1 box of 72 zip ties
Unit Count: 72
Number of Packs: 1
One thing I found interesting:
This is optional.
So this isn't necessarily a case of changing every existing variation immediately.
I'd first look at the current variation structure, customer experience, and how the products are actually packaged before making the switch.
Amazon says the theme will expand into additional categories later in 2026.
Another small catalog change that could have a big impact on how customers understand your products.
#Amazon #AmazonFBA #AmazonSeller #Ecommerce #AmazonListings

The network for creativity
Join 1.25M professional creatives like you
Connect with clients, get discovered, and run your business 100% commission-free
Creatives on Contra have earned over $150M and we are just getting started





Related posts

One brand, very different variety products. 👀
BASYX is one of my favorite projects because the packaging had to work across categories, from skincare to food, while still feeling like one cohesive brand.
That’s the fun challenge of multi-product brands: creating a visual system flexible enough to grow without losing its identity.

amazing!

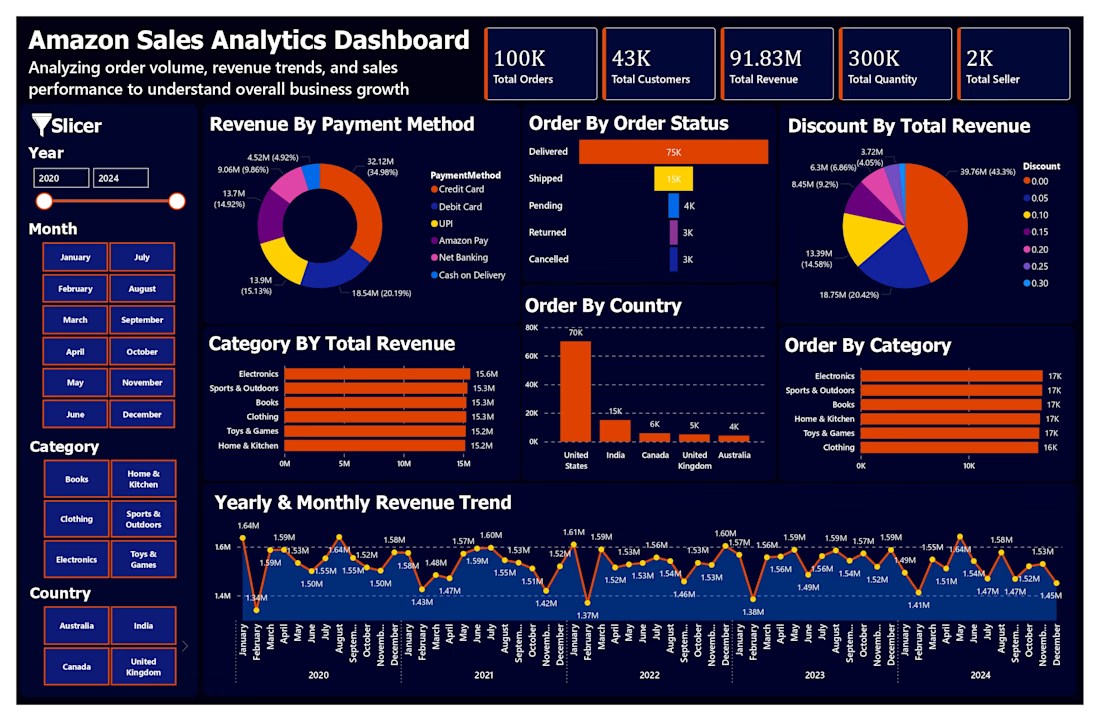
Amazon Sales Analytics Dashboard | Power BI
Just completed another Power BI project focused on Amazon Sales Performance & Revenue Analysis.
I worked with sales data to understand overall business performance across different areas such as:
• Payment Method
• Order Status
• Country
• Product Category
• Discount
• Total Orders & Customers
• Total Revenue & Quantity
• Yearly & Monthly Revenue Trends
The dashboard includes KPIs, interactive slicers, charts, and detailed visualizations to make sales data easier to understand and analyze.
🛠️ Tools Used:
Power BI | Power Query | DAX | Data Cleaning | Data Visualization
This project helped me improve my skills in sales analytics, dashboard development, data visualization, and business insights.
More projects coming soon. 🚀
#PowerBI #DataAnalytics #DataAnalyst #SalesAnalytics #AmazonSales #PowerQuery #DAX #DataVisualization #BusinessIntelligence #Dashboard #DataAnalyticsProject





Thrive Syracuse is better for me I like how its color is vibrant ❤️❤️