The network for creativity
Join 1.25M professional creatives like you
Connect with clients, get discovered, and run your business 100% commission-free
Creatives on Contra have earned over $150M and we are just getting started
Back to feedPost

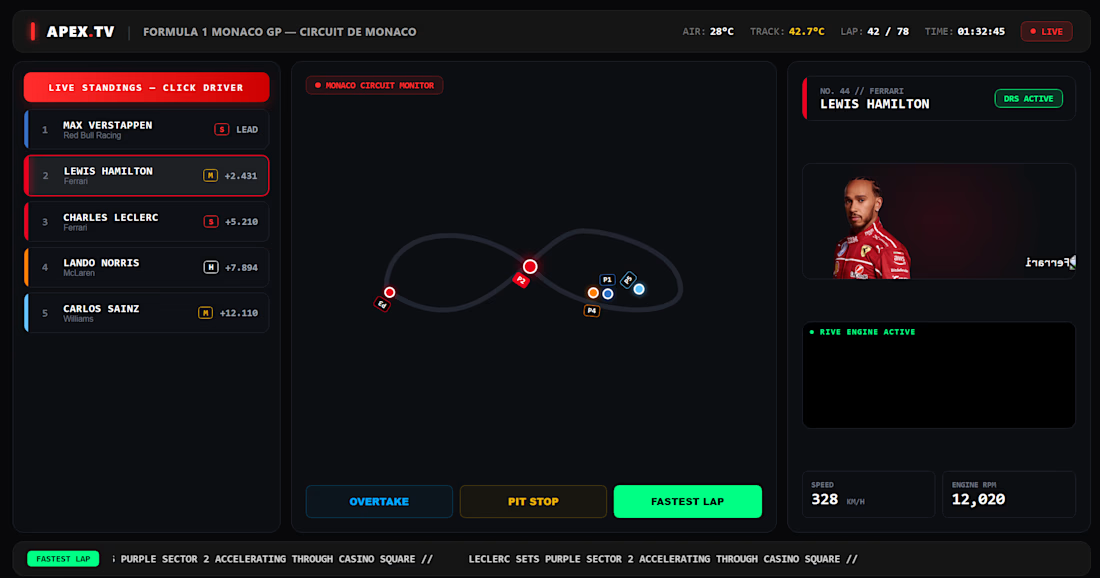
A Real-Time Formula 1 Broadcast & Telemetry Dashboard modeled after official TV race broadcasts. It is built using React, TypeScript, Framer Motion, and Rive Canvas Graphics.
Live Standings Tower (LeaderboardTower): Displays driver positions (P1–P5), team colors, gap times, and tire compounds (SOFT, MEDIUM, HARD). Selecting a driver immediately focuses the rest of the dashboard on them.
Interactive Circuit Monitor (TrackMap): An animated SVG map of the Monaco Grand Prix circuit. All 5 driver positions orbit the track simultaneously with dynamic speed offsets based on live telemetry and race events.
Real-Time Telemetry & Rive Engine (TelemetryPanel): Displays active Speed (KM/H), Engine RPM, DRS activation, shift light warnings, official driver portraits, and 3D car models. It pipes speed and RPM metrics straight into an active Rive Canvas engine state machine to handle visual performance feedback.
Race Control Controls & Ticker: Interactive control triggers (OVERTAKE, PIT STOP, FASTEST LAP) that instantly modify telemetry values, car pacing, and broadcast banner notifications in real time.
Why It Was Built
Interactive F1 Broadcast Experience: Traditional telemetry dashboards present raw data in static tables. This dashboard recreates the high-energy visual experience of official F1 TV broadcasts with instant driver switching.
Dynamic Vector Animation with Rive: Standard UI components struggle with smooth 60 FPS graphics during rapid data changes. Integrating Rive provides smooth WebAssembly-powered canvas rendering driven by live state inputs (Speed & RPM).
Multi-Driver Track Visualization: Most race monitors display only one car at a time. This implementation dynamically renders all 5 grid drivers along a shared vector path, maintaining accurate gaps, team branding, and interactive highlights.
Data-Driven Telemetry Simulation: Demonstrates how data flows through modern Web Apps—from state modifications in App.tsx down to smooth telemetry updates in the individual telemetry widgets.


The network for creativity
Join 1.25M professional creatives like you
Connect with clients, get discovered, and run your business 100% commission-free
Creatives on Contra have earned over $150M and we are just getting started











Related posts

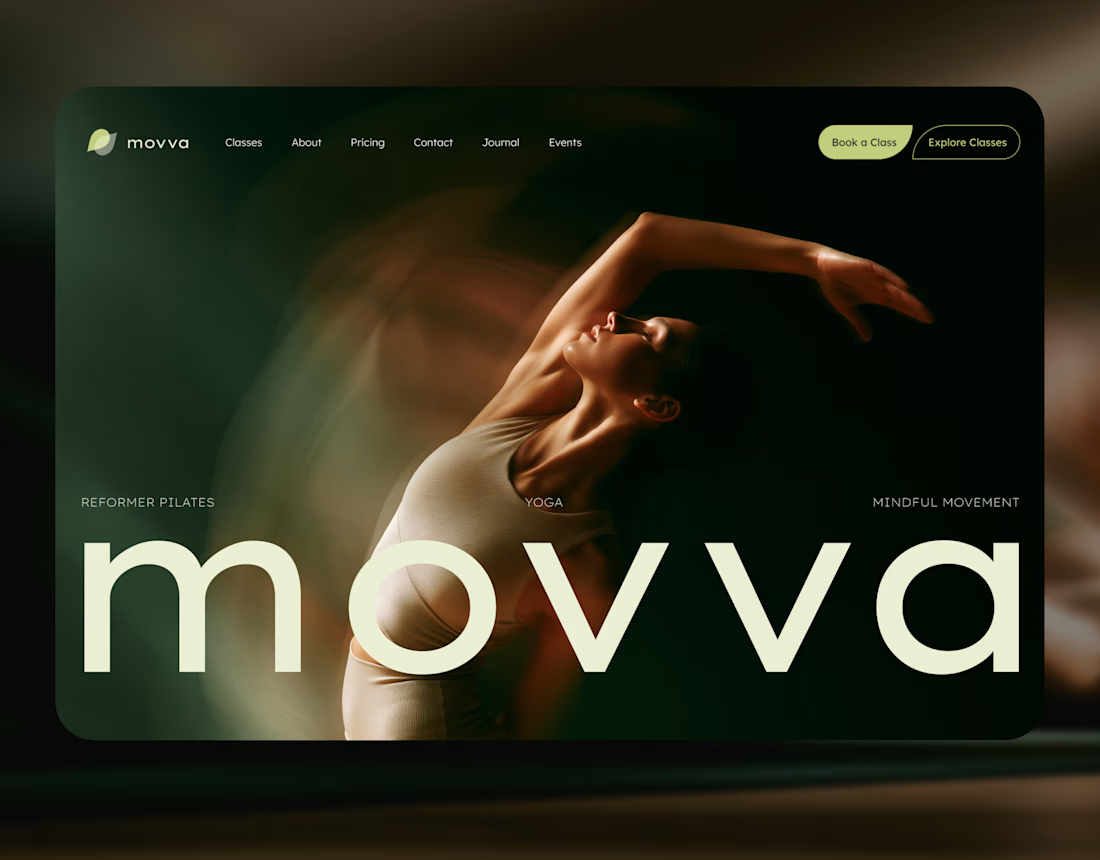
MOVVA is now featured on Contra 🤍
I’m especially happy about this because working on this template was a creative outlet for me.
I wanted to build something useful for a business: a website that covers what a studio needs when it opens, from an easy-to-use schedule to clearly structured class information, with a solid foundation for SEO.
At the same time, I wanted it to feel beautiful. To bring a sense of movement, lightness, and the joy of taking a class into the design. To capture that friendly atmosphere that makes you want to walk into a studio and give it a try.
Thank you, Contra team!


Huge congrats on getting featured! 🤍 MOVVA looks stunning - love the mindful movement vibe and that hero image. Super useful concept for studios. Well deserved feature!


This UI was really great nice job Piotr🔥🔥🔥

An interaction study for Mare’s collection feed, exploring how to make groups legible within a dense, mixed-format archive.
The layout preserves image proportions and integrates collection labels into the packing system. On hover, image-derived gradients establish the collection boundary, while subtle displacement creates space around the active group without changing its position or scale.
The motion studies isolate assembly, packing, colour and proximity, using real collection content to examine timing, spatial continuity and hover behaviour.