The network for creativity
Join 1.25M professional creatives like you
Connect with clients, get discovered, and run your business 100% commission-free
Creatives on Contra have earned over $150M and we are just getting started
Back to feedPost

I've always found Value Stream Mapping interesting.
It's not just about drawing boxes and arrows. It's about understanding how materials and information flow, where time is spent, and where opportunities for improvement exist.
I've been working on making VSM creation more practical through e-VSM.
Here's a little preview of what I've been building.
I'm curious: how do you currently create and maintain your VSM?
Excel, PowerPoint, specialized software, or something else?


The usual answer is PowerPoint or Visio, and the map goes stale soon after the workshop. If e-VSM can pull cycle times from live data, keeping the map current becomes the real selling point.
The network for creativity
Join 1.25M professional creatives like you
Connect with clients, get discovered, and run your business 100% commission-free
Creatives on Contra have earned over $150M and we are just getting started
Related posts

Your Business Doesn't Need More Tools. It Needs Better Systems.
Most businesses don't have a software problem. They have an integration problem.
Their CRM is disconnected from their database. Their spreadsheets require manual updates. Their reports take hours to prepare. Their teams waste valuable time moving information between platforms.
That's where I come in.
I'm a Full-Stack AI Engineer specializing in building connected, intelligent business systems.
What I can build for your business:
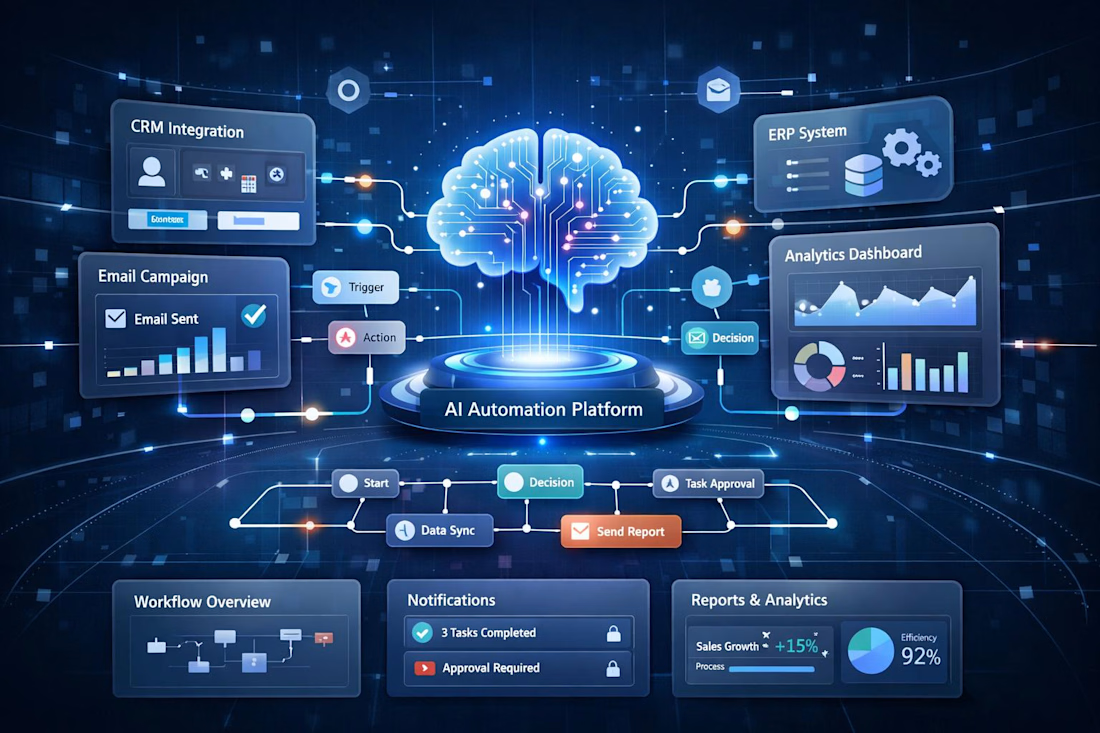
CRM & ERP Integrations — Connect business platforms, databases, and third-party services through APIs.
Workflow Automation — Eliminate repetitive processes with intelligent automation.
Custom Dashboards — Turn scattered business data into actionable insights.
Data Pipelines — Build reliable systems for collecting, processing, validating, and synchronizing data.
AI-Powered Solutions — Integrate LLMs, intelligent agents, and automation into existing workflows.
Custom Software — Build complete web applications and business platforms from architecture to deployment.
I've independently developed complex digital platforms, including government-level systems, international applications, and AI-powered products.
My approach is simple:
Understand the business problem. Design the right architecture. Build the complete solution. Make it reliable.
I'm interested in working with founders, agencies, and businesses looking to modernize their operations and build software that actually solves problems.
Have a complex workflow or an integration challenge? Let's build something that works.
#FullStackDevelopment #AIAutomation #CRMIntegration #WorkflowAutomation #SoftwareEngineering #AIEngineering #Contra

When a CRM-to-database sync fails halfway, how do you handle it: idempotent retries, or a reconciliation pass afterward? That's usually where integrations start to drift.

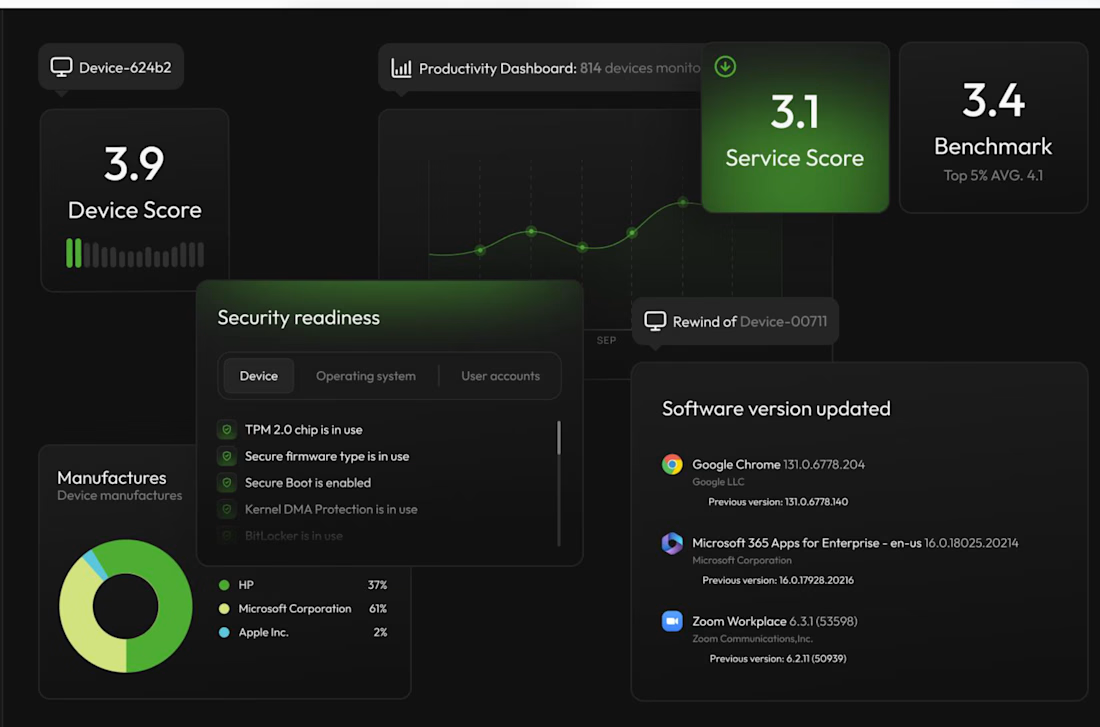
Device Health Monitoring Dashboard
Device monitoring
Analytics and reporting
Status tracking
Error monitoring



Nice dashboard work!