The network for creativity
Join 1.25M professional creatives like you
Connect with clients, get discovered, and run your business 100% commission-free
Creatives on Contra have earned over $150M and we are just getting started
Back to feedPost
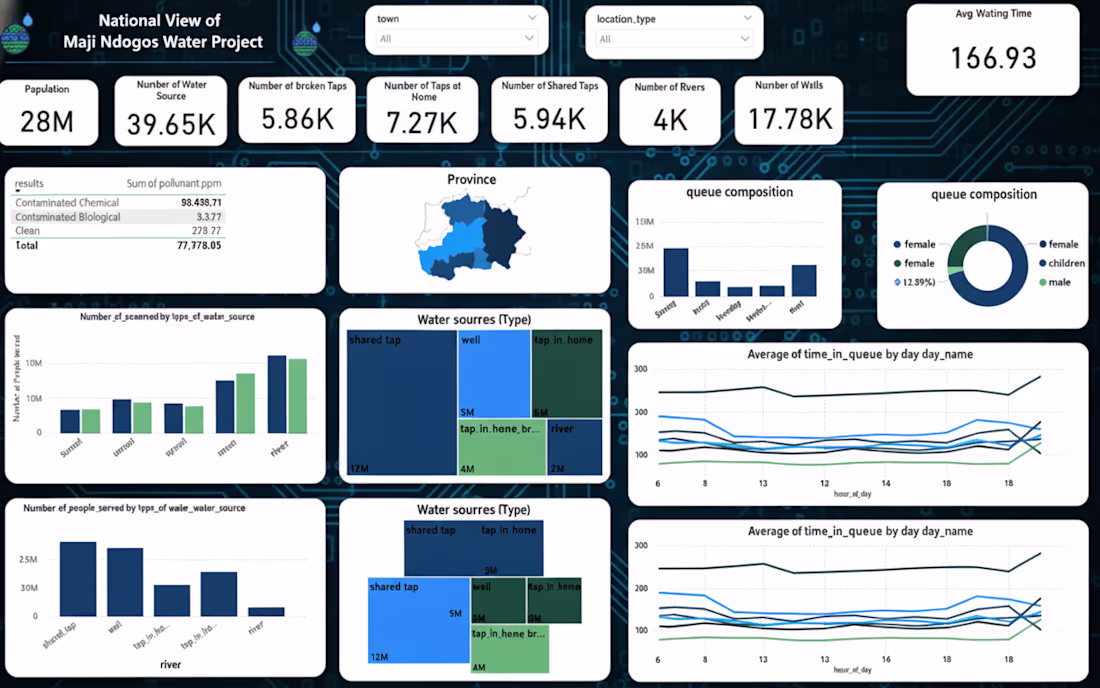
Maji_ndos_powerbi_dashboard – Part 1 & 2
I’ve been building interactive Power BI dashboards for the Maji Ndos / Maji Ndogo water projects to help stakeholders understand water access across communities. The dashboards combine population data, water source availability, and usage patterns to reveal insights at national, provincial, and local levels.
What you can explore:
Population size and water source counts
Queue times by day of the week
Usage breakdowns by gender and age
Maps, tree maps, and charts for national and provincial overviews
Interactive filters for province, town, and location type
Skills applied:
Data cleaning and transformation, data modeling (fact/dimension tables, star schemas, bridging tables), DAX measures, interactive dashboard design, and visualization best practices.
The network for creativity
Join 1.25M professional creatives like you
Connect with clients, get discovered, and run your business 100% commission-free
Creatives on Contra have earned over $150M and we are just getting started
Trending
Claude
Claude has entered the design space. How are you using Claude Design?
Contra University
Learn from expert creatives how to earn more using next-gen AI tools.
creativeaiflow
Creative AI workflows are evolving. What tools do you use, and what are their strengths and weaknesses?
freelancerlife
Freelancer life is wins, pivots, and everything in between. What’s yours right now?