The network for creativity
Join 1.25M professional creatives like you
Connect with clients, get discovered, and run your business 100% commission-free
Creatives on Contra have earned over $150M and we are just getting started
Back to feedPost

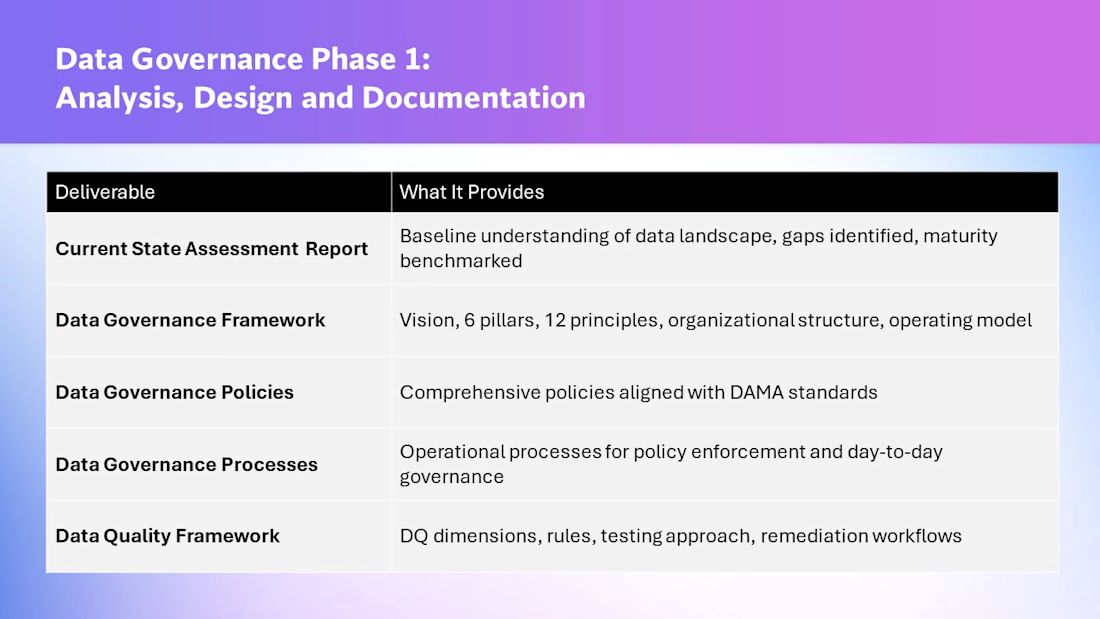
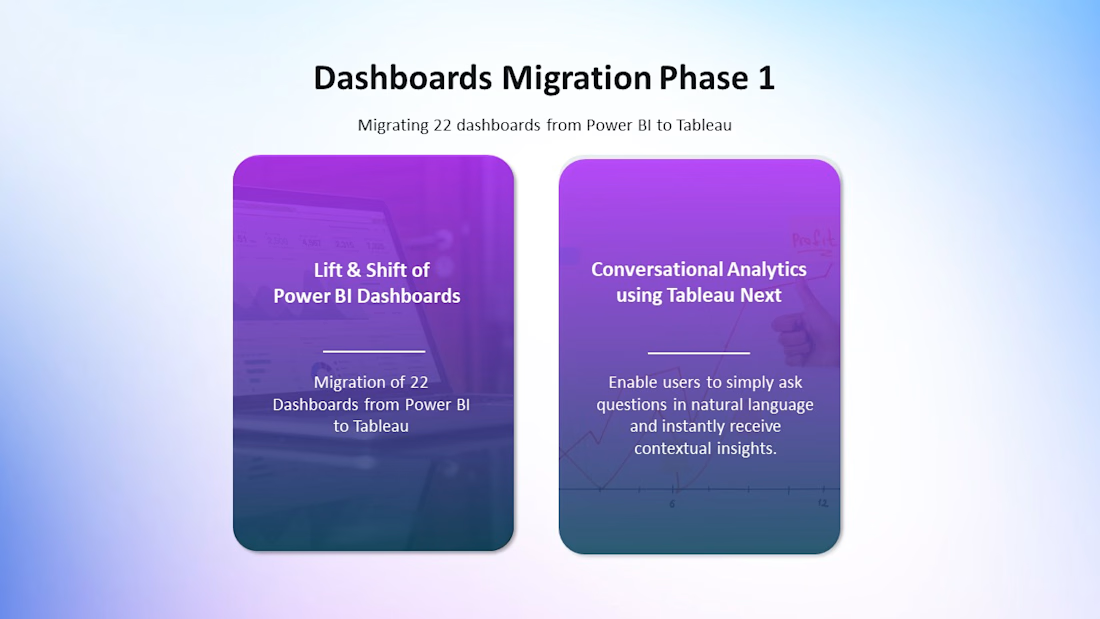
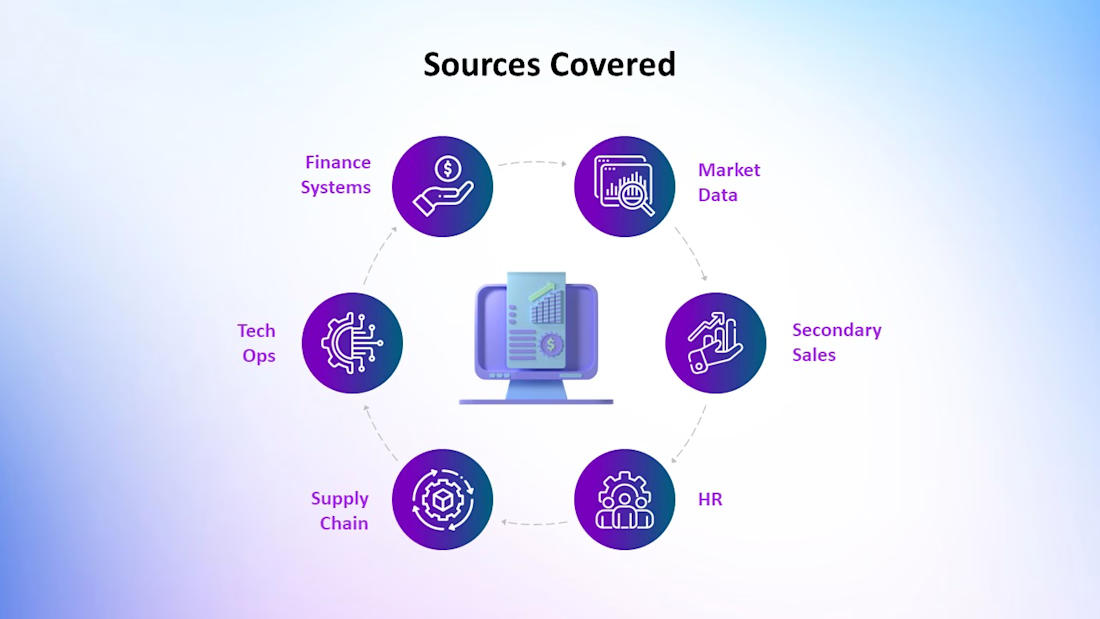
Phase 1: Migration of Power BI to Tableau Dashboard
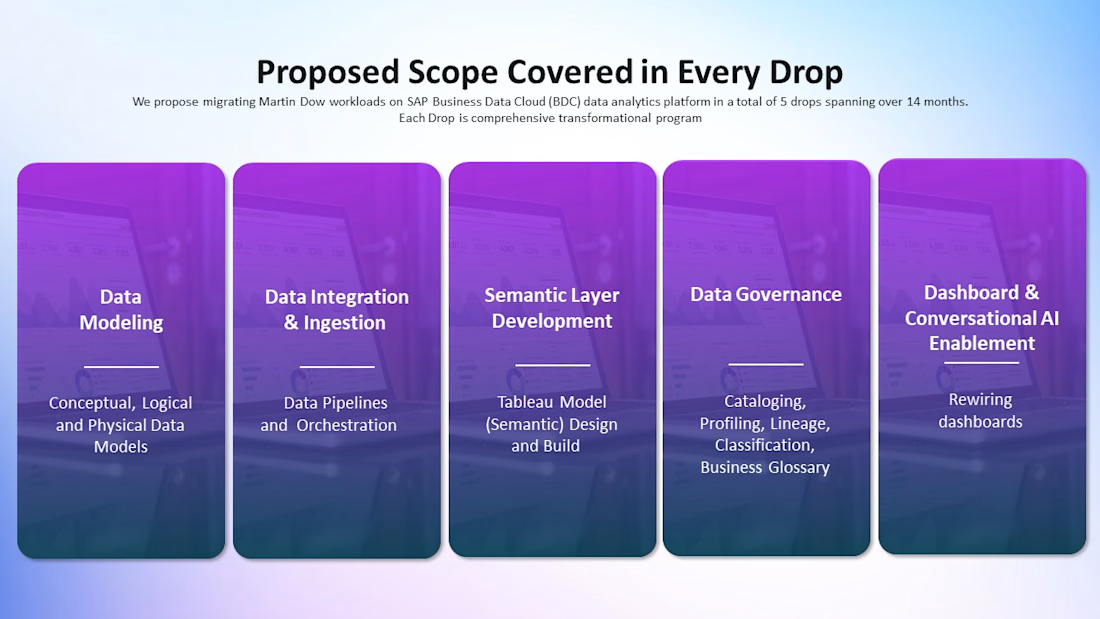
Phase 2: Migration of SAP BW to SAP BDC


The network for creativity
Join 1.25M professional creatives like you
Connect with clients, get discovered, and run your business 100% commission-free
Creatives on Contra have earned over $150M and we are just getting started





Related posts

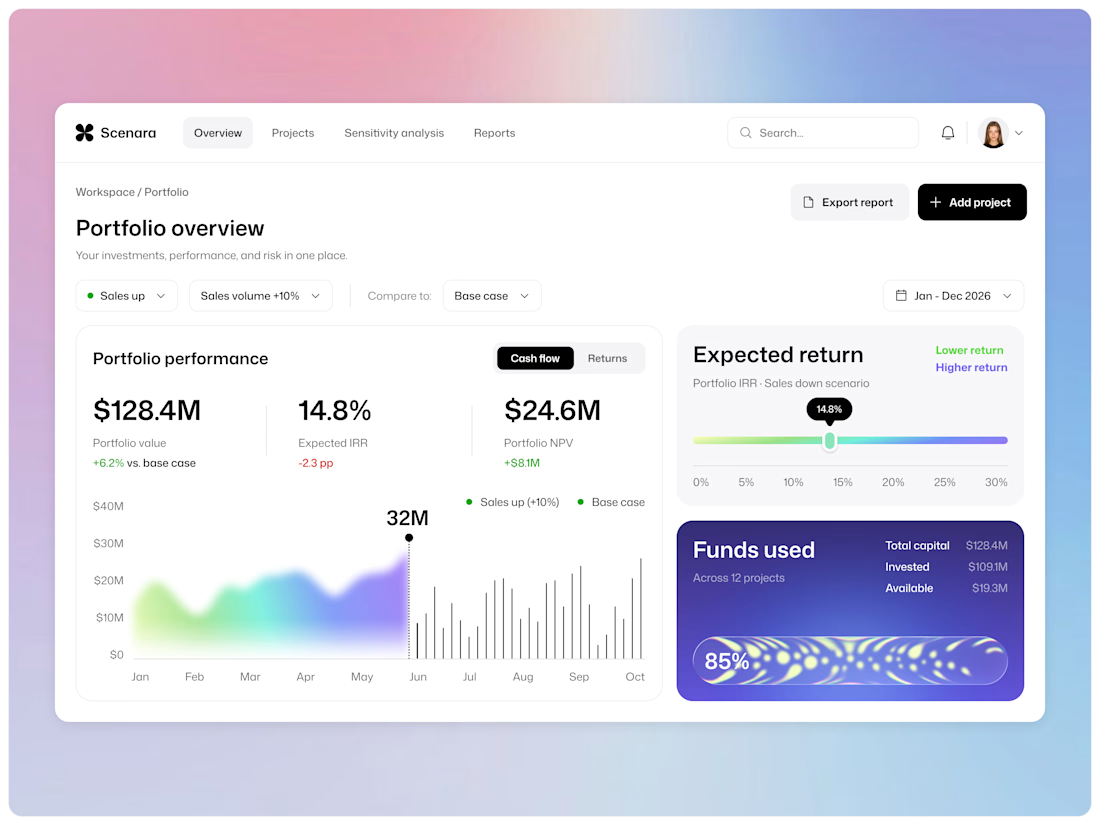
“What if sales drop 10%?” For a portfolio manager working across multiple investment projects, answering that question can mean days of rebuilding spreadsheets.
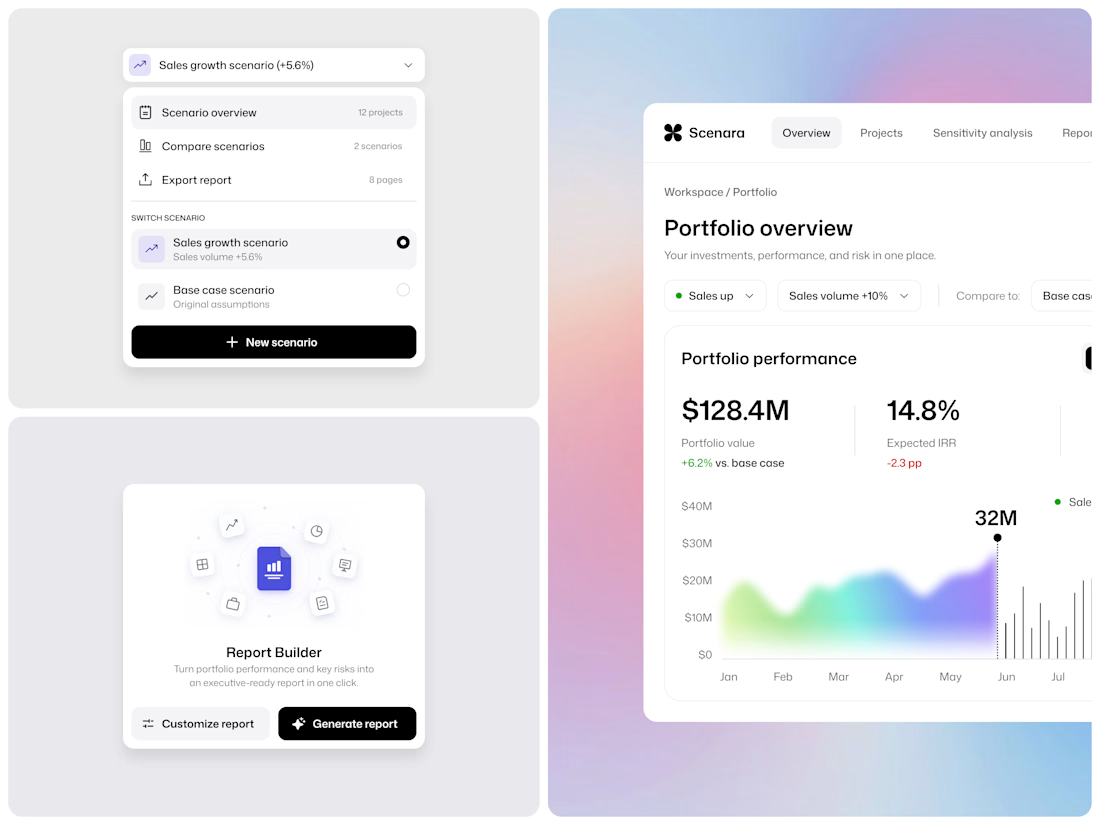
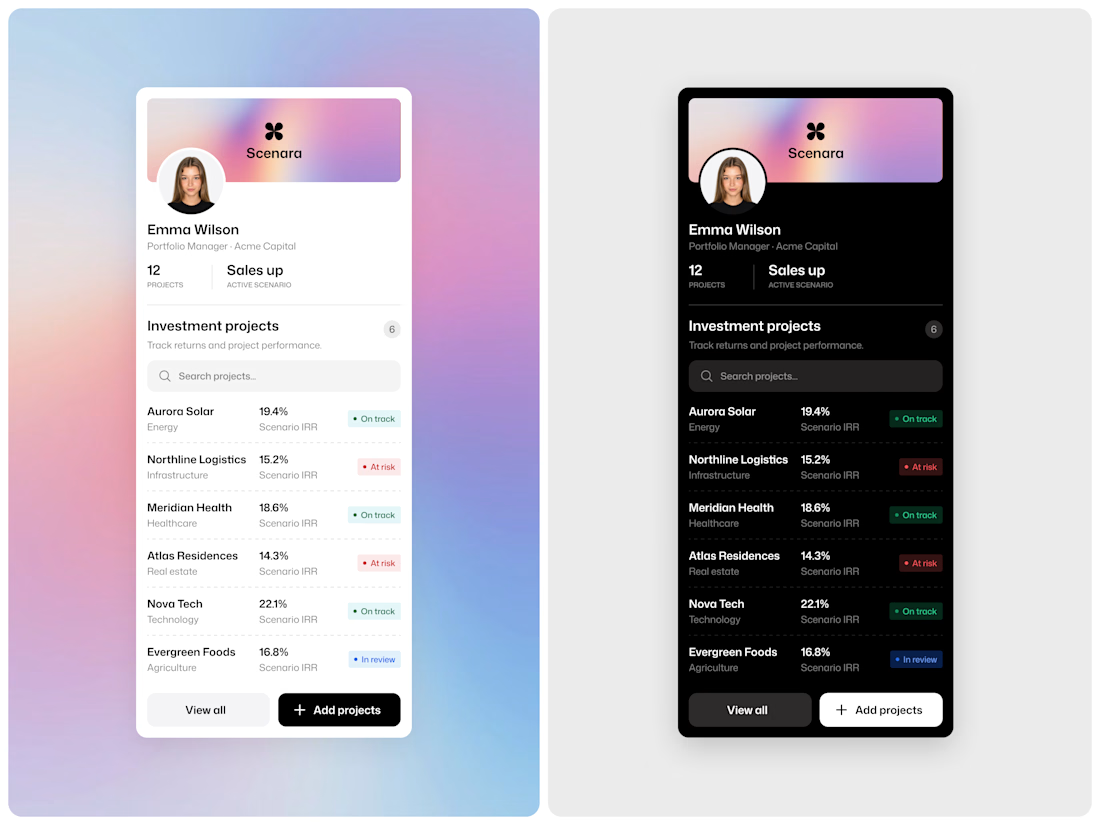
Scenara is an investment portfolio dashboard designed to make scenario analysis faster and clearer. Change one assumption and compare it with the base case. Review project status and returns across a 12-project portfolio. Turn performance and key risks into an executive-ready report.
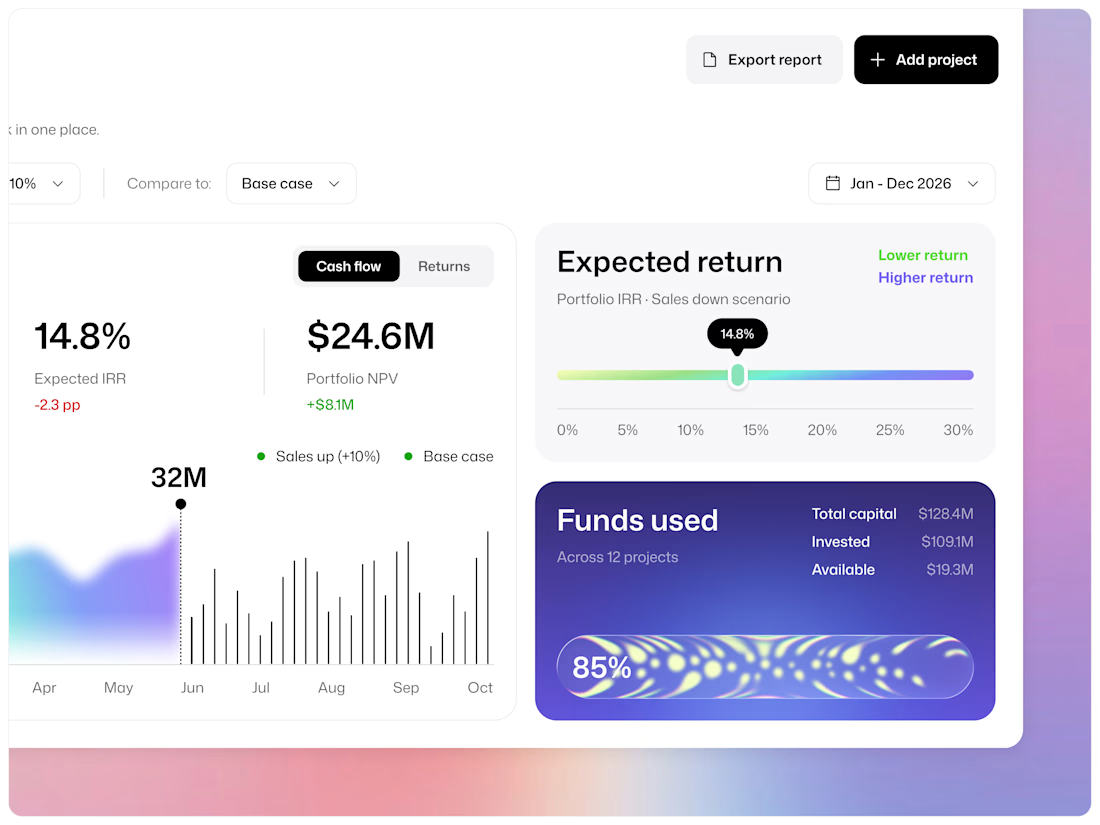
In one “Sales up” scenario, portfolio value grows by 6.2% while IRR drops by 2.3 percentage points. The dashboard makes this trade-off visible so teams can consider the full picture before making a decision.
Numbers stay calm and easy to read. Color is reserved for meaningful differences, including return ranges, cash flow, and invested capital. The mobile view brings the portfolio into one list, with light and dark modes.
This is a self-initiated exploration shaped by our experience with investment and banking projects, most of which are covered by NDA.
For fintech teams, what’s the first number you check on Monday morning?
Emote is a UX/UI design studio for fintech, SaaS, health tech, and AI products. Get in touch to discuss your project and see how we approach our work.

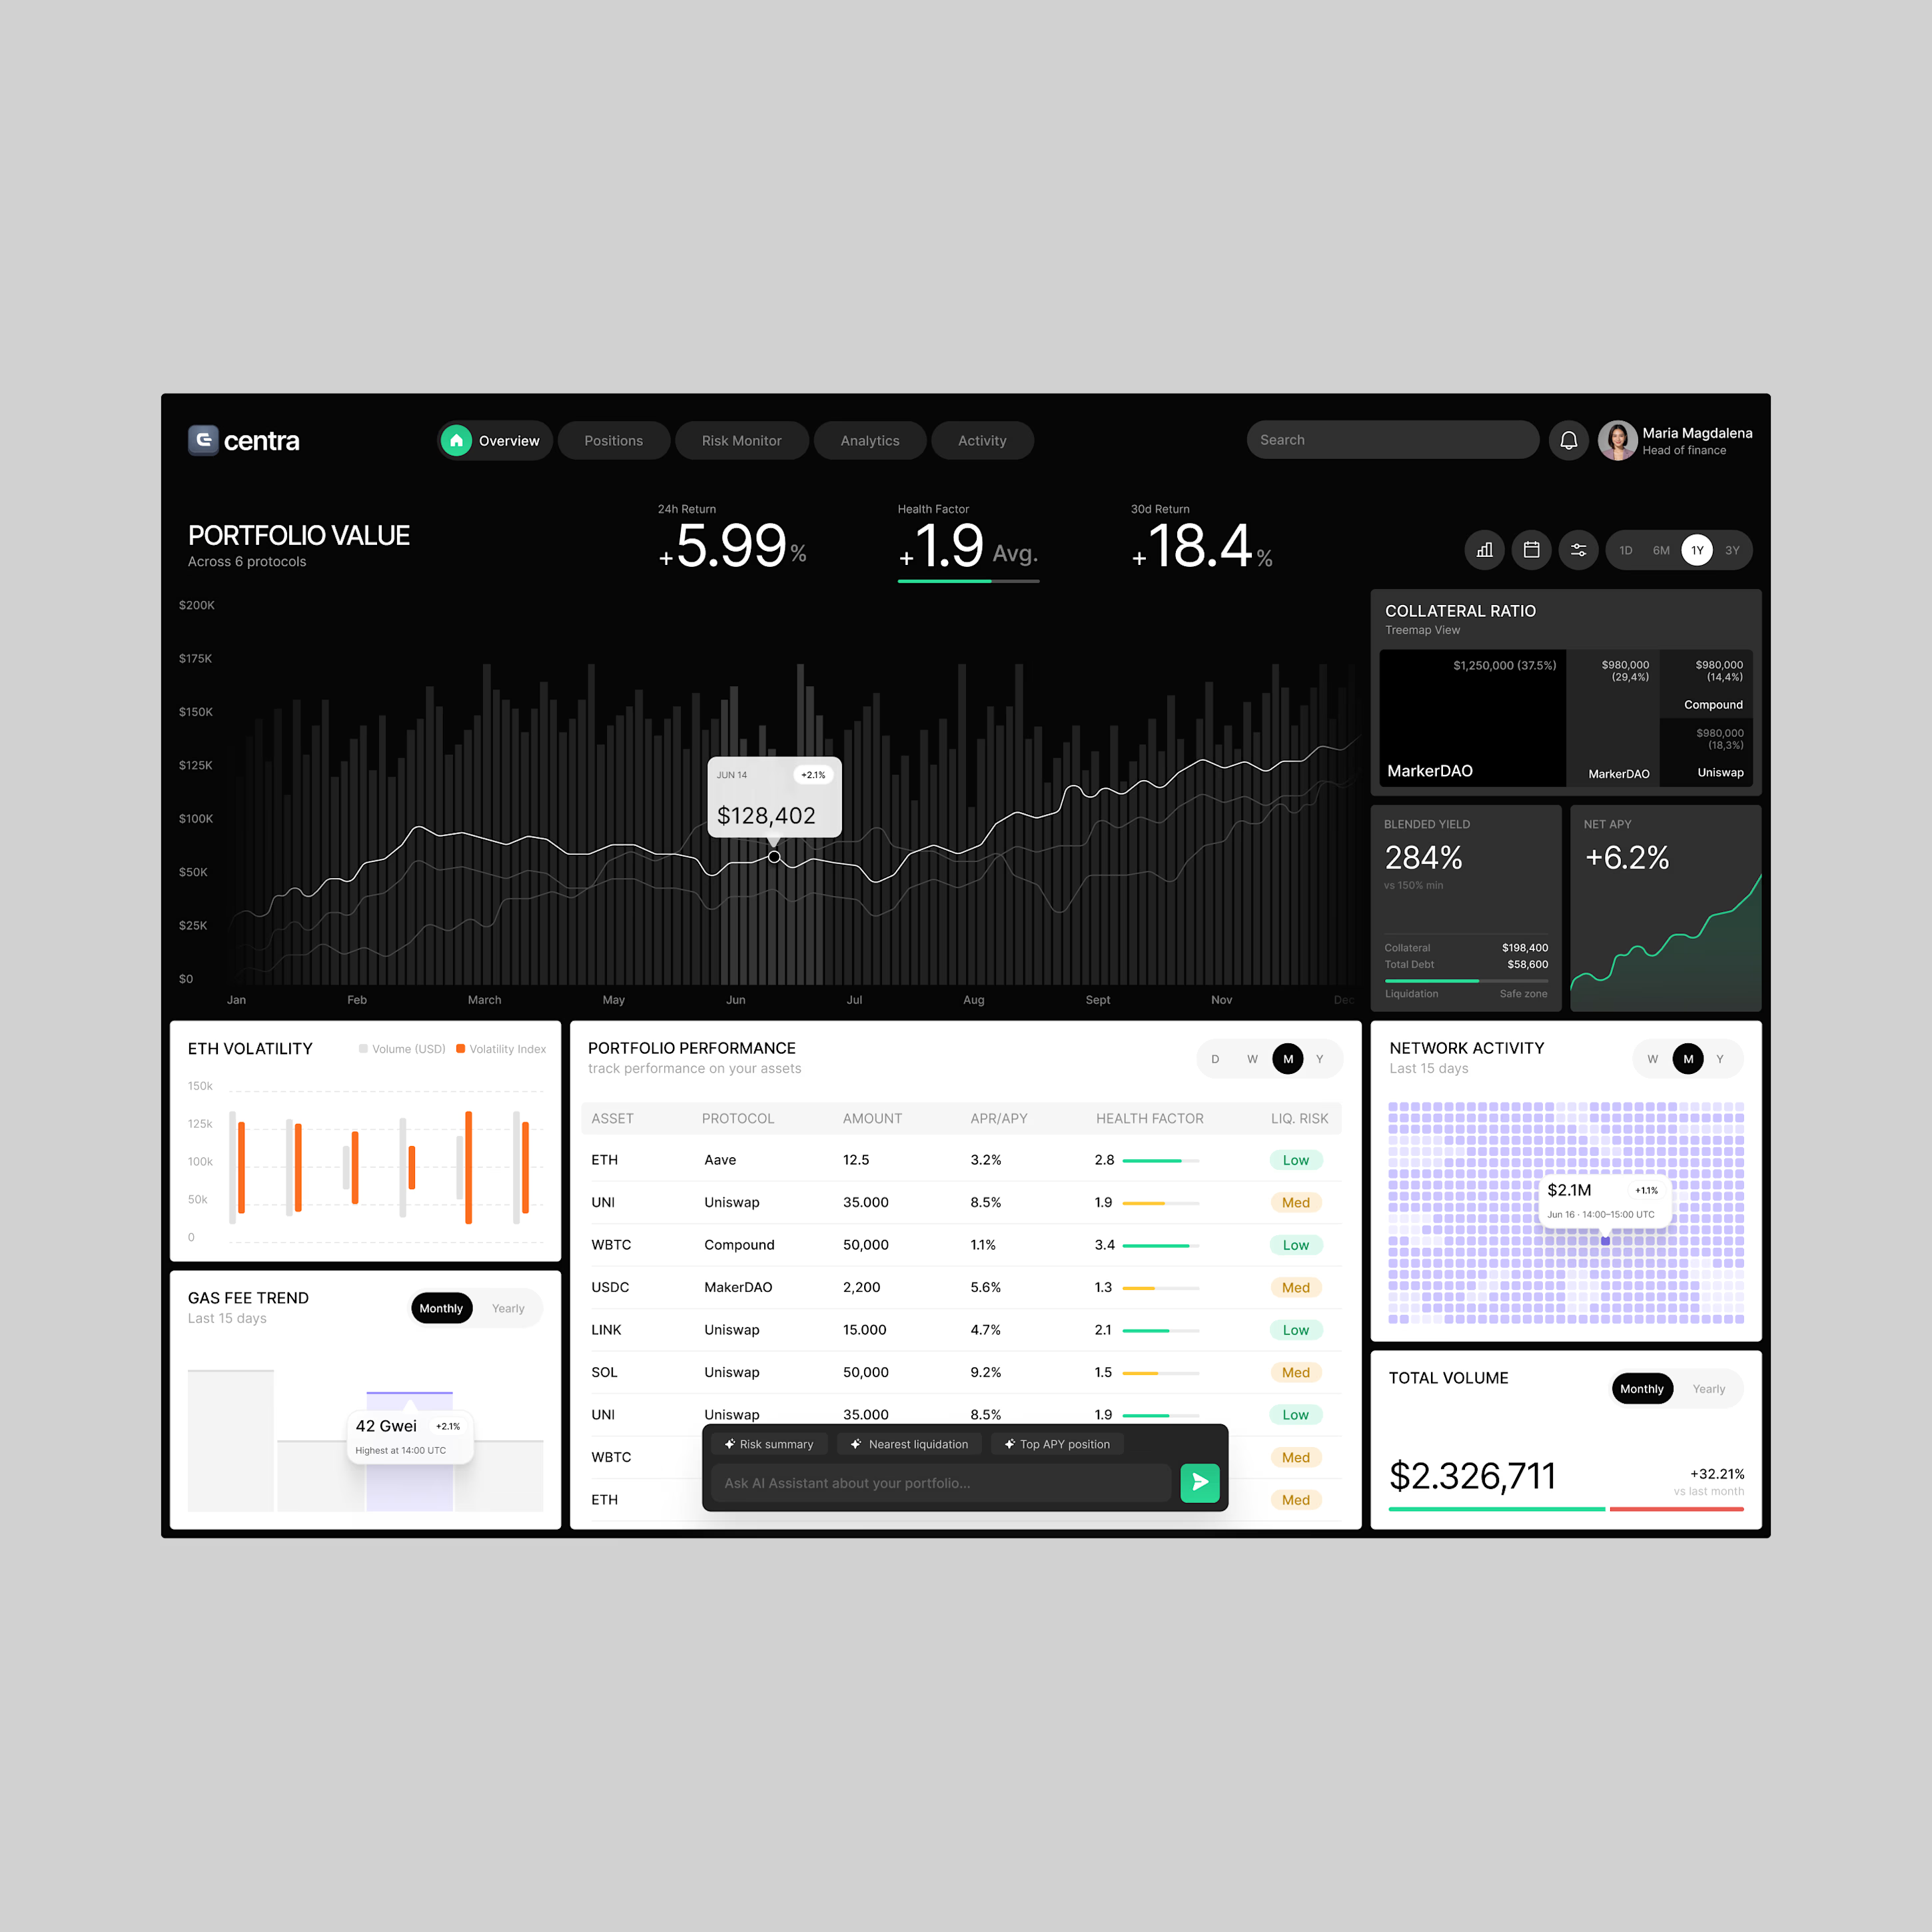
Making complex DeFi data easier to manage. Centra brings portfolio insights and risk analytics into one clean dashboard.
Want to create something like this?
Let's Talk!



I had the pleasure to relaunch the Austrian B2B Site of Eventim/Ticketmaster - Webflow was definitely a help achieving this. Onwards!


