The network for creativity
Join 1.25M professional creatives like you
Connect with clients, get discovered, and run your business 100% commission-free
Creatives on Contra have earned over $150M and we are just getting started
Back to feedPost

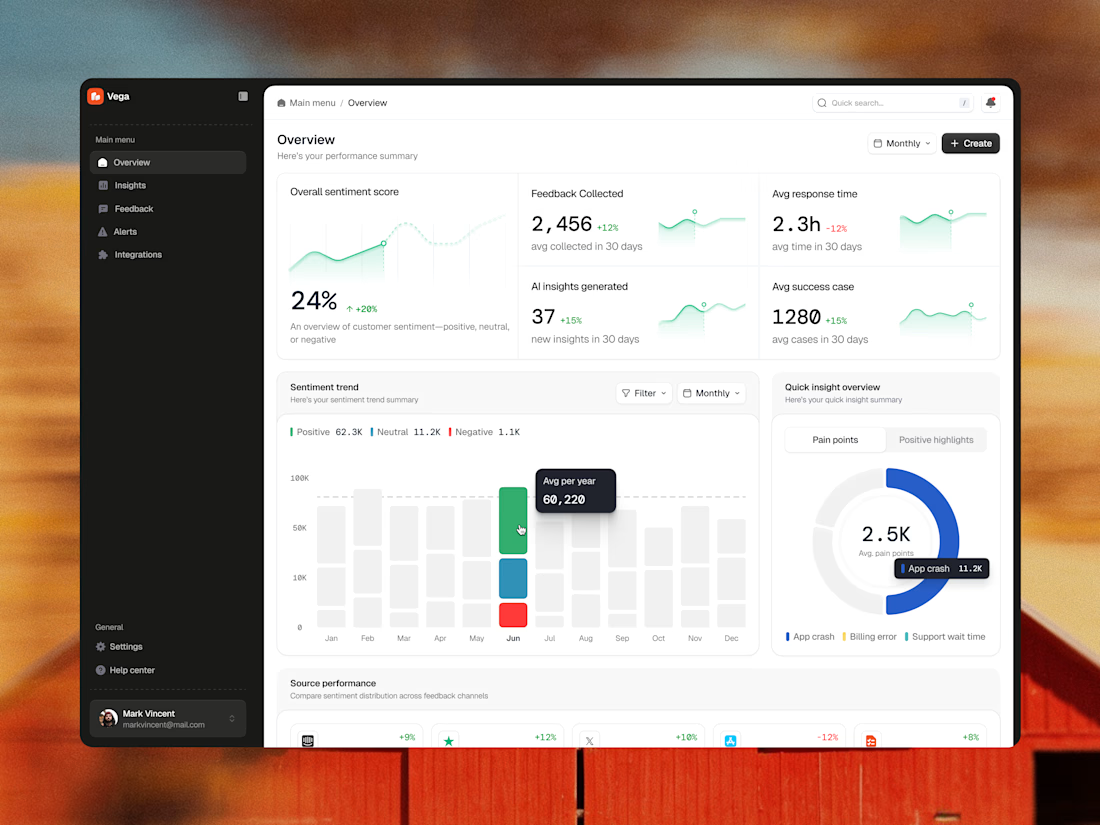
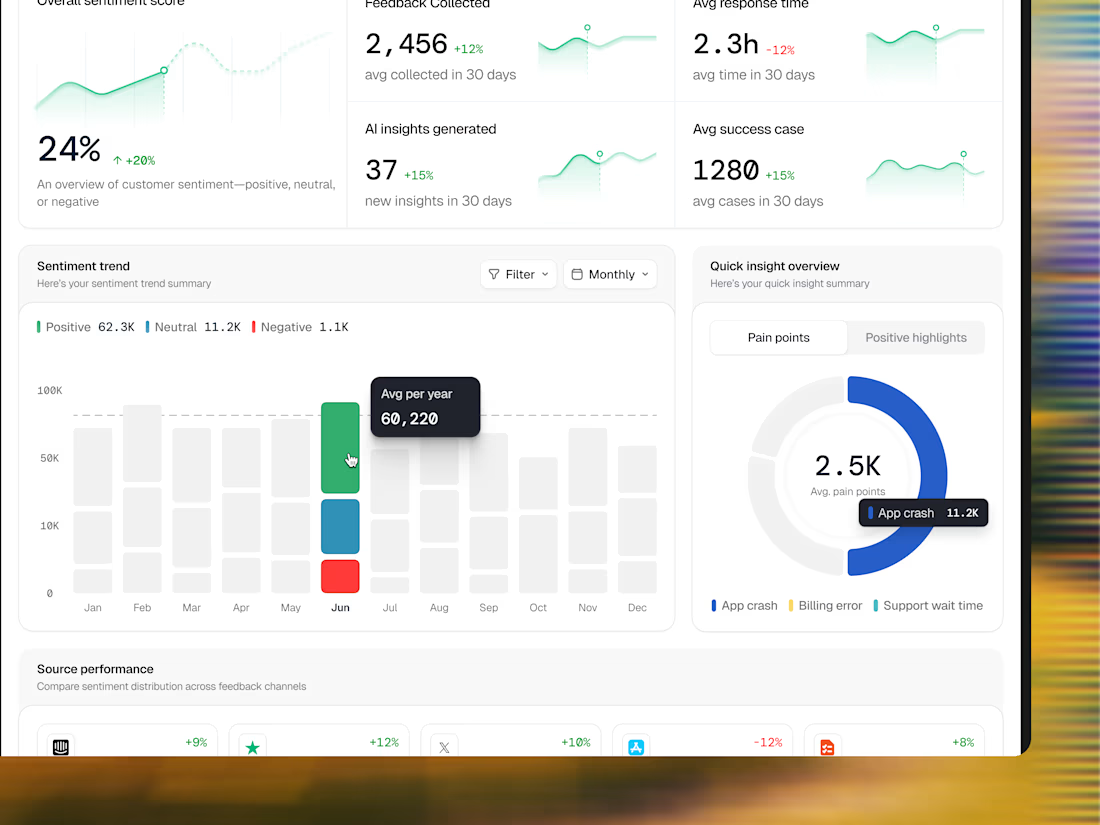
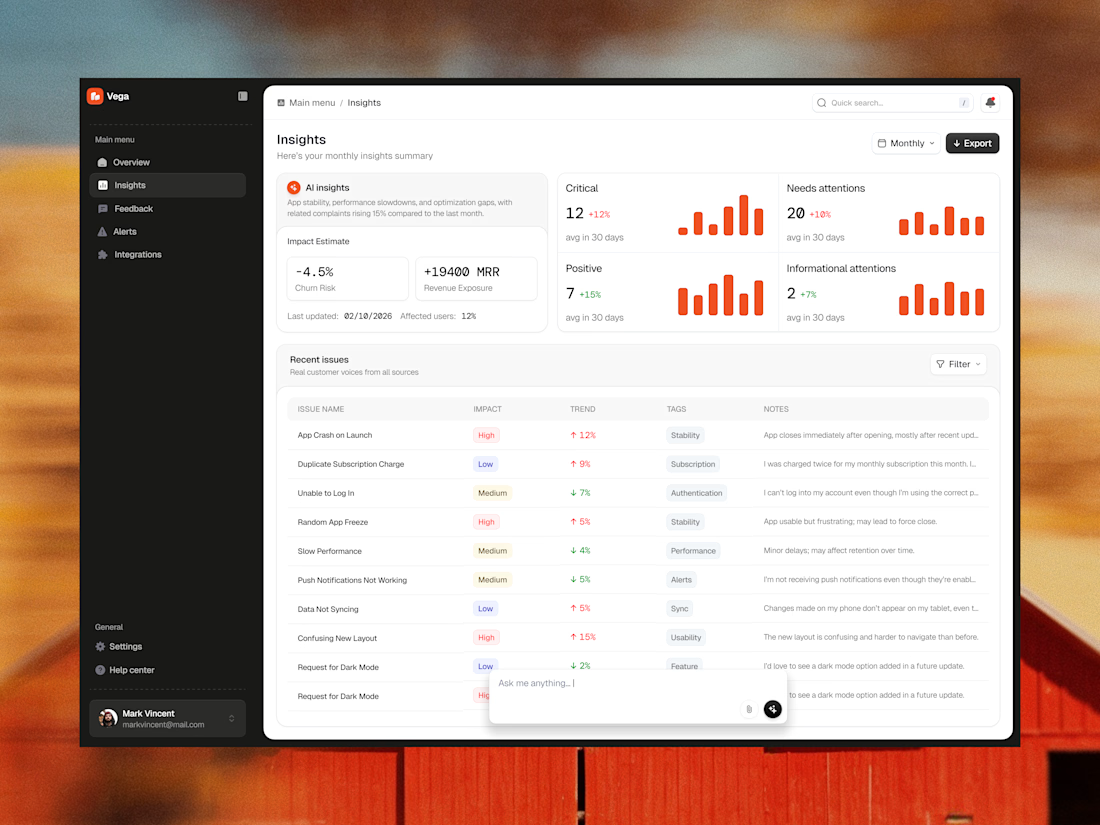
How do you turn cold, sterile data grids into a visually stunning operation hub? Here is our team’s take on Vega — Enterprise AI Analytics Dashboard. ✨
When designing an enterprise-grade platform, balancing extreme data density with design aesthetics is always a tough tightrope to walk. Look at how we handled the visual breakdown:
📊 Modular Clarity: Clean, responsive UI elements built to isolate complex data without creating user fatigue.
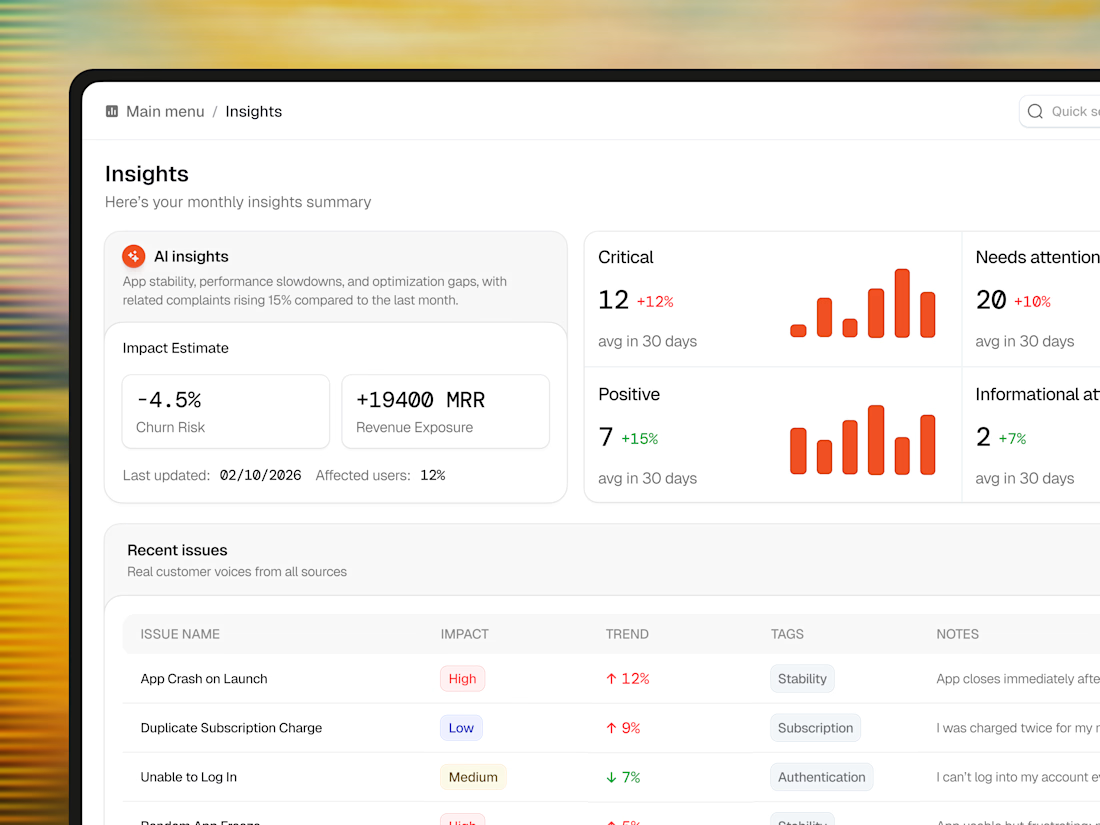
🍊 Intentional Accents: A restrained dark canvas paired with strategic red and orange data bars to signal urgency instantly.
💬 The Narrative Layer: Blending real-time customer voices seamlessly next to complex technical charts.
Feedback, thoughts, and support are always appreciated. ❤️


The network for creativity
Join 1.25M professional creatives like you
Connect with clients, get discovered, and run your business 100% commission-free
Creatives on Contra have earned over $150M and we are just getting started
Related posts

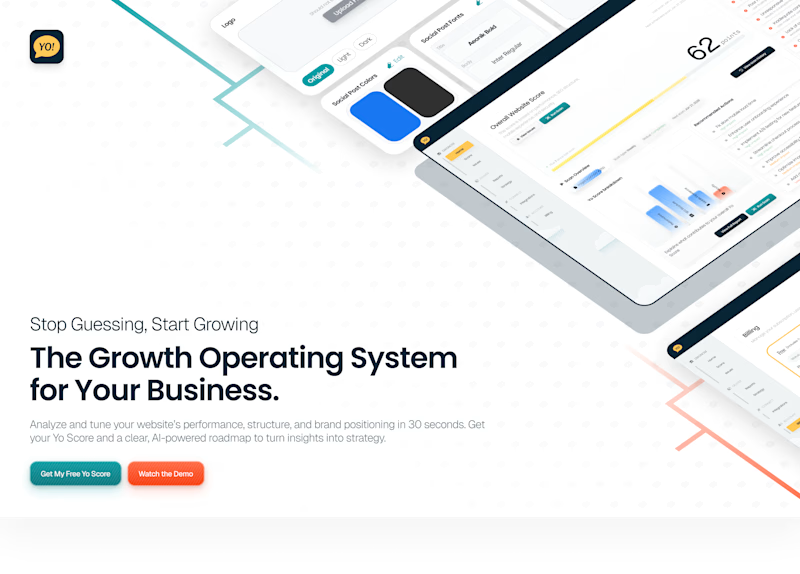
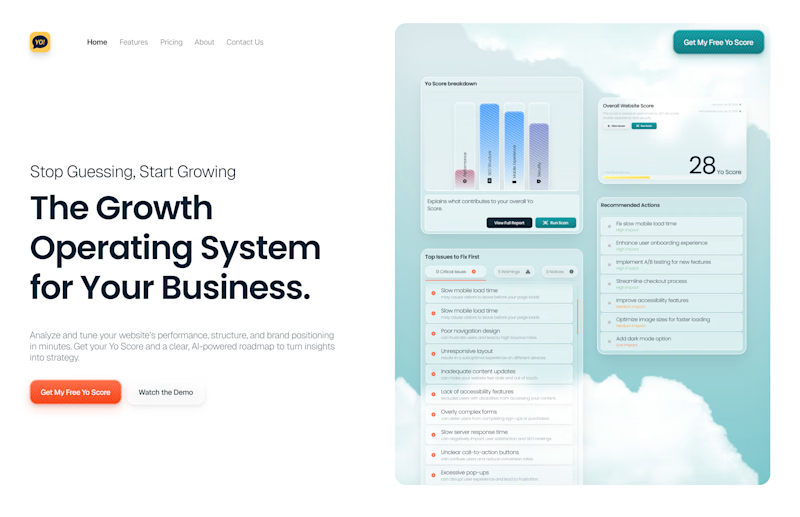
Designed these hero sections for a landing page for a marketing OS landing page. Do you prefer Option A which teases the product at a glance or Option B which focuses on the product features.
5 voted
63%
3 voted
37%
8 votes
Closed

Option A for me.
Love the concept's tension


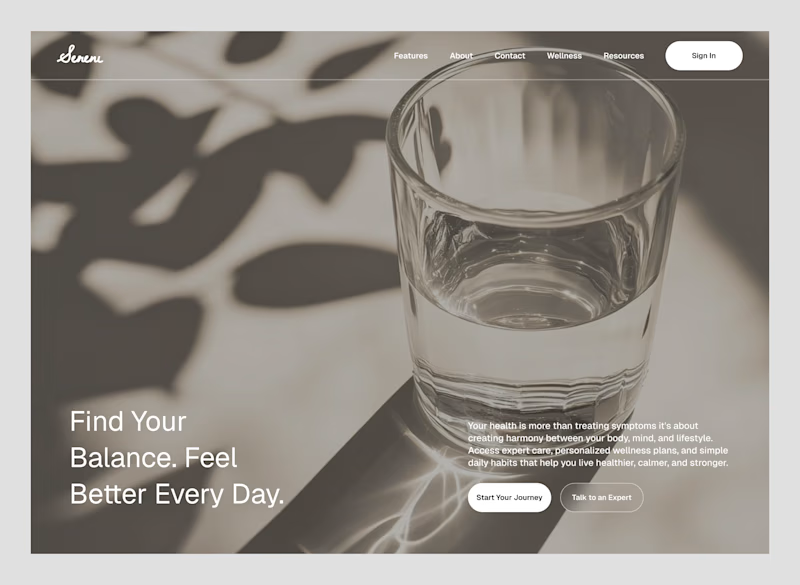
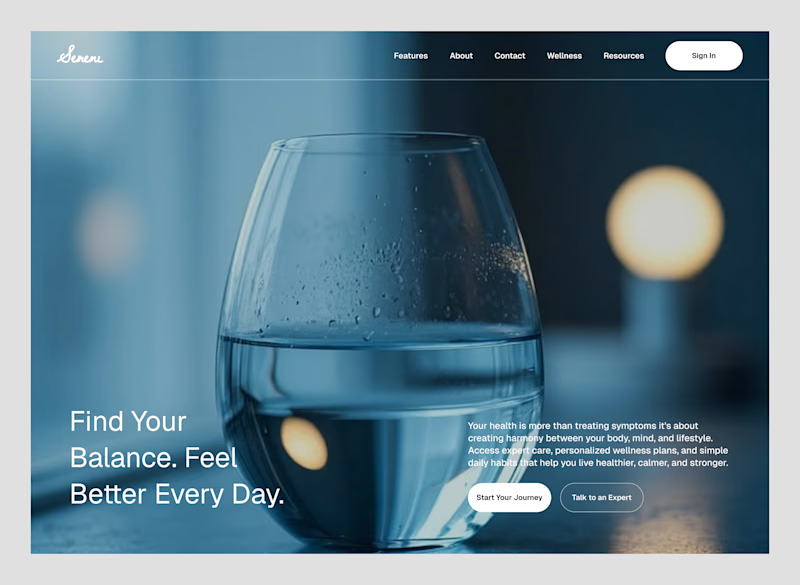
Exploring two visual directions for the same hero concept.
Version 1
A clean glass cup using natural light and reflections to create a calm, minimal feel. The focus here is clarity, simplicity, and a more realistic atmosphere.
Version 2
A transparent glass set against a soft blue backdrop. This direction leans into a more polished, modern aesthetic with stronger contrast and a subtle tech-inspired feel.
Both communicate transparency but in very different ways.
Which direction would you choose for a premium health & wellness landing page: Version 1 or Version 2? I'd love to hear why.
1 voted
13%
7 voted
87%
8 votes
Closed

Version 2








Trending

Claude
Claude has entered the design space. How are you using Claude Design?

Contra University
Learn from expert creatives how to earn more using next-gen AI tools.
fifaworldcup2026
The World Cup is here and the whole world's watching. How are you designing for the world stage?
creativeaiflow
Creative AI workflows are evolving. What tools do you use, and what are their strengths and weaknesses?
freelancerlife
Freelancer life is wins, pivots, and everything in between. What’s yours right now?