The network for creativity
Join 1.25M professional creatives like you
Connect with clients, get discovered, and run your business 100% commission-free
Creatives on Contra have earned over $150M and we are just getting started
Back to feedPost

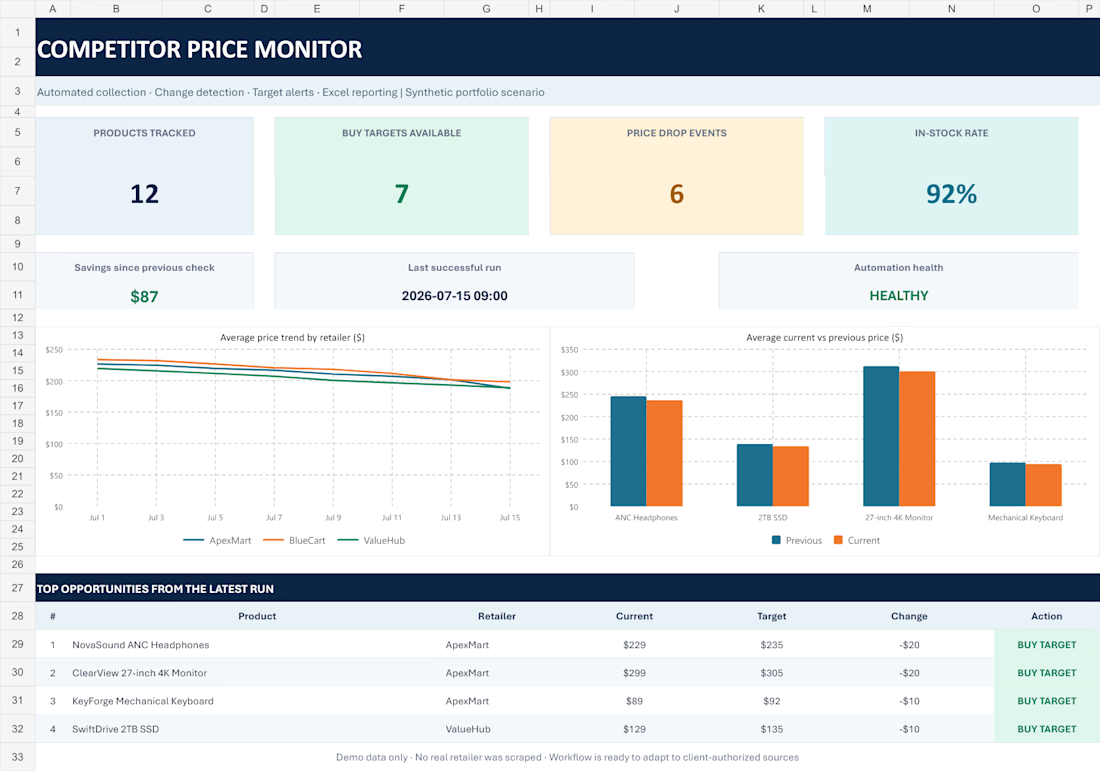
I built a local Python price-monitoring starter kit to replace repetitive manual checks.
The useful part is not just collecting prices — it is keeping the workflow auditable:
• append-only price history and change logs
• price-drop, target-price, and stock-change alerts
• CSV, JSON, and a readable HTML digest
• no telemetry, with SMTP disabled by default
I verified the synthetic demo across 12 fictional targets and 8 snapshots: 96 history rows, 12/12 successful checks in the latest run, and 13 generated alerts.
It is intentionally a transparent Python source kit, not a universal no-code scraper. JavaScript-rendered, login-protected, or unusual pages can require custom adaptation.
What is the hardest part of price monitoring in your workflow: changing layouts, noisy alerts, or JavaScript rendering?

The network for creativity
Join 1.25M professional creatives like you
Connect with clients, get discovered, and run your business 100% commission-free
Creatives on Contra have earned over $150M and we are just getting started




Related posts


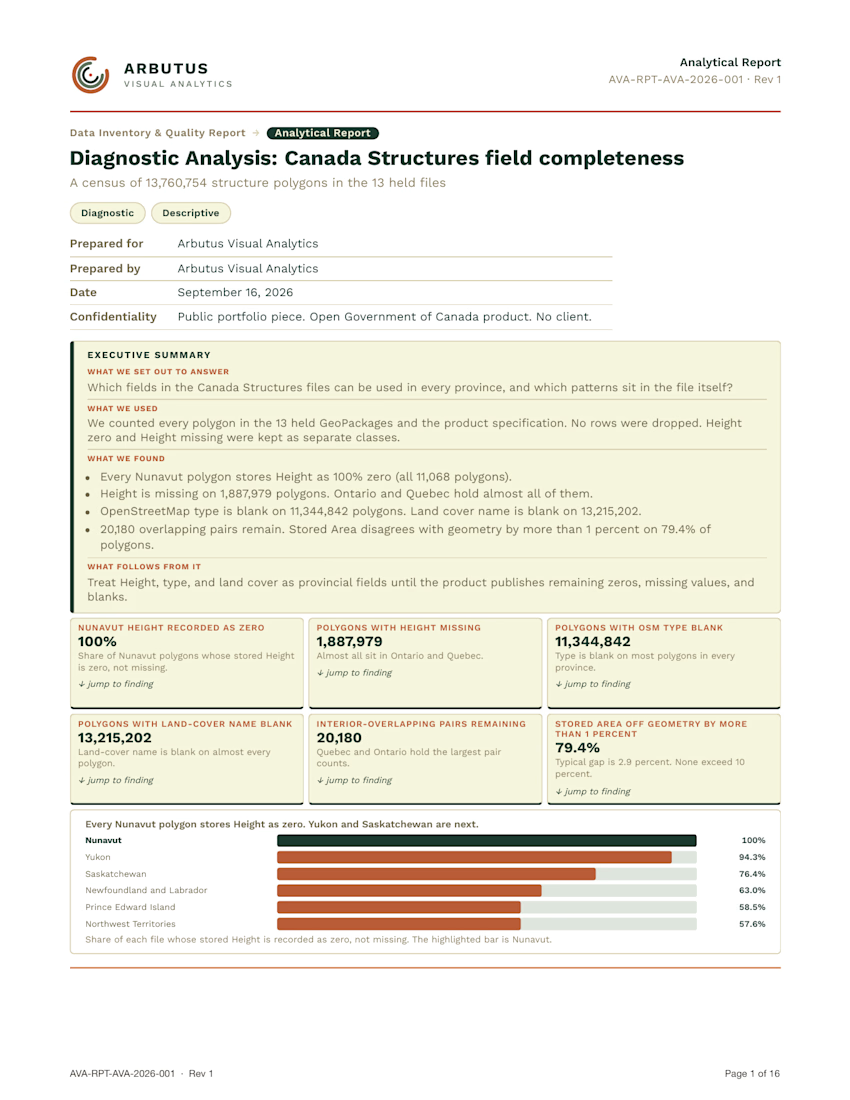
If you have ever been handed a dataset and wanted to know the integrity of the content, and any key information sitting inside it, you needed a descriptive analysis.
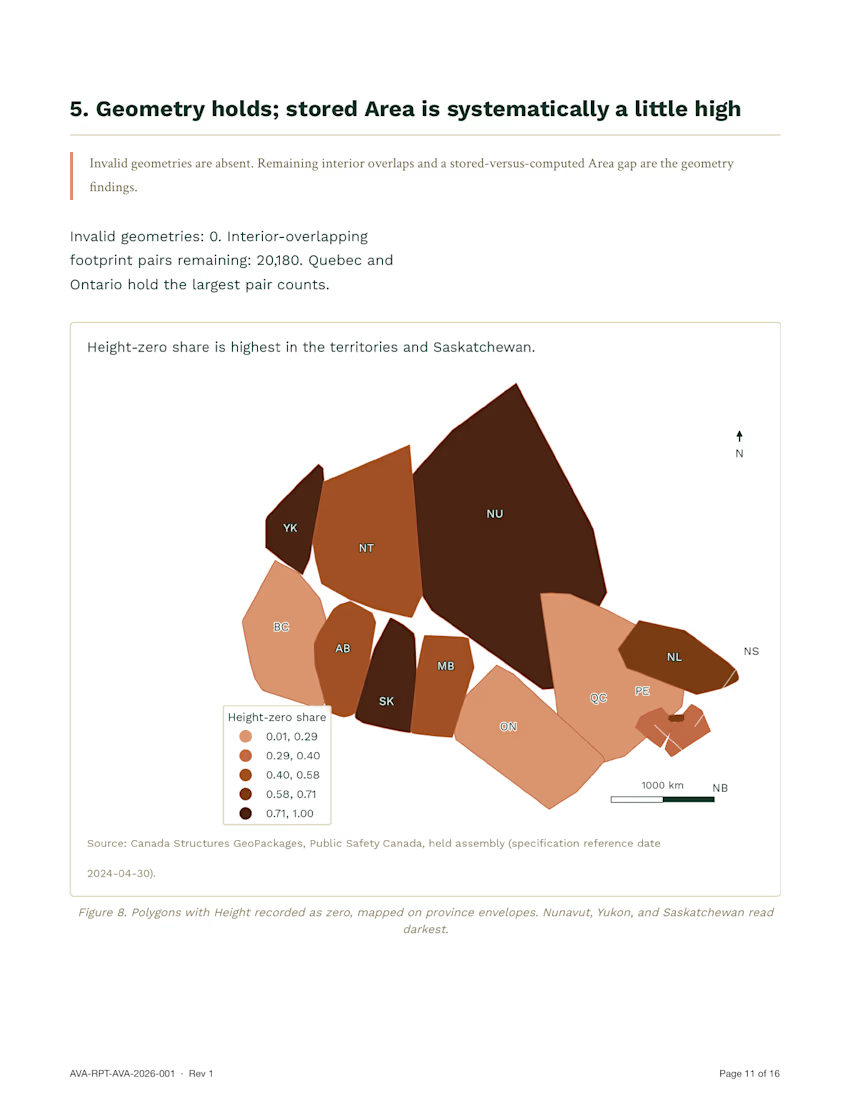
This is a descriptive analysis of Canada Structures, the federal building-footprint product. A file like this is assembled from several sources and file types, and that mix can leave artifacts. The work was looking for those artifacts so the file can be trusted before anyone treats stored height or type as national fields.
National count is 13,760,754, matching the spec. Every Nunavut footprint stores height as zero (11,068). 66.5% of footprints have a positive stored height. 82.4% carry no building type. Shape, size, and province together score 0.42 at guessing source class, against 0.32 from province alone.




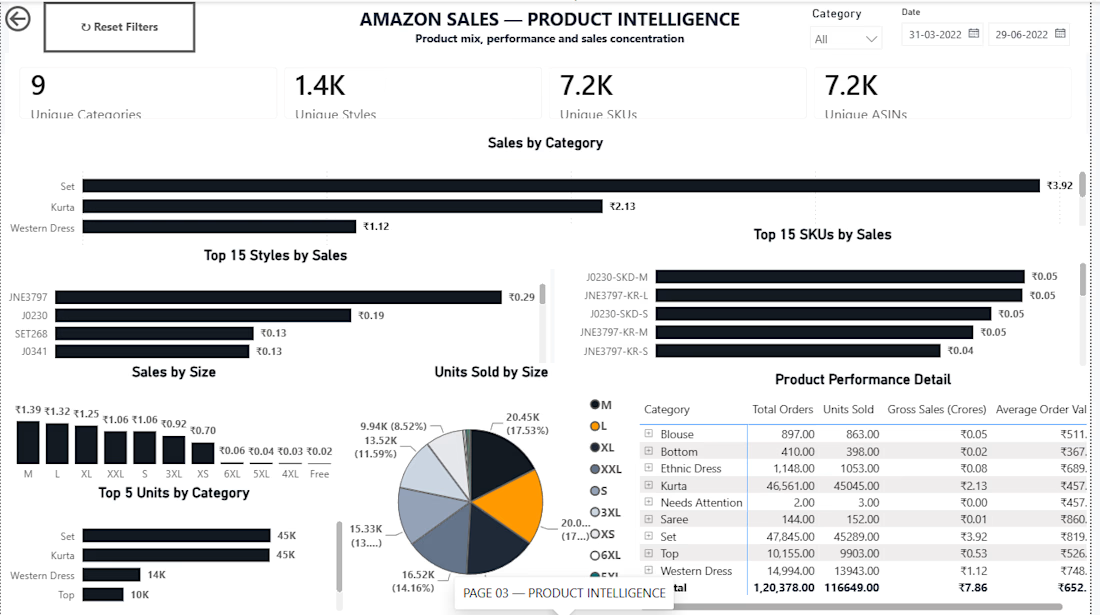
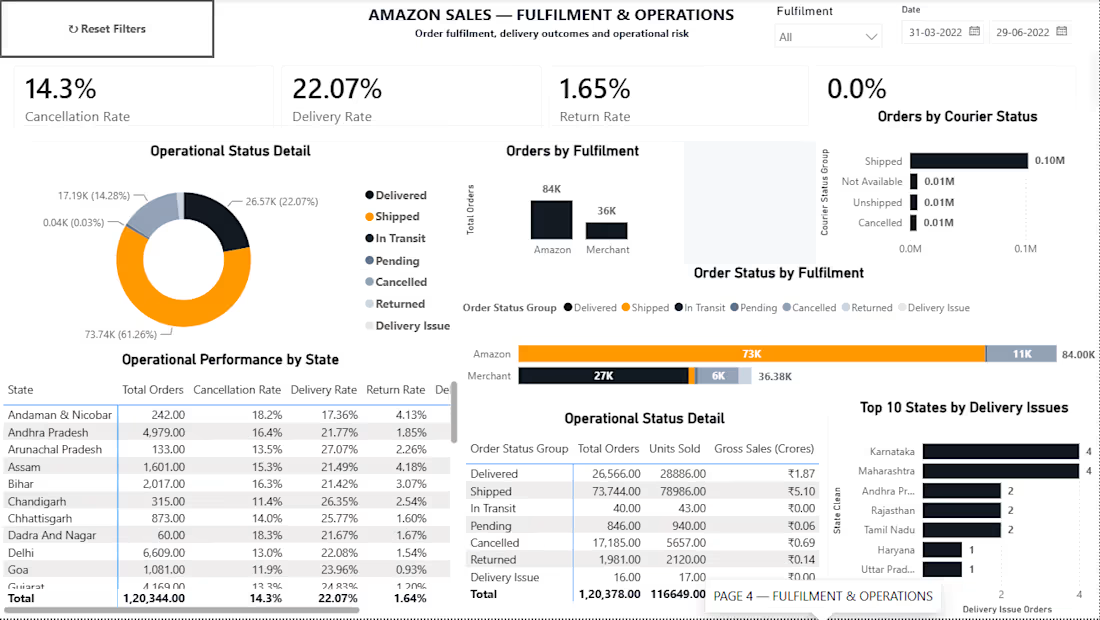
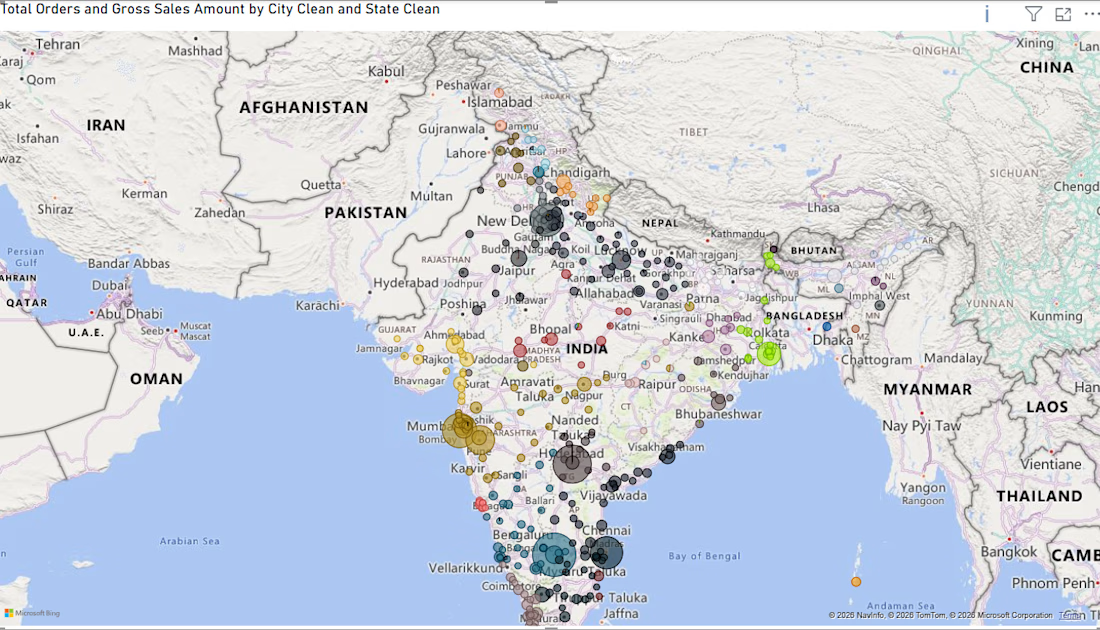
ARTHADṚṢṬI — Amazon Sales Intelligence & Business Performance System
What started as an analytics project became an opportunity to build something closer to a real-world business reporting system.
I worked with Amazon sales data and took it through an end-to-end analytics workflow:
Raw Data → Data Cleaning → Transformation → Data Modeling → DAX → Power BI → Business Insights
What I worked on
• Data profiling and quality checks
• Cleaning & transformation using Power Query
• Handling missing and inconsistent data
• Business KPI development
• Data modeling
• DAX measures
• Interactive dashboard design
• Sales, product, fulfilment & geographic analysis
The final system provides visibility into:
→ Sales & revenue performance
→ Orders and units
→ Category & SKU performance
→ Fulfilment operations
→ Monthly trends
→ Geographic distribution
→ Interactive filtering & drill-down analysis
But the biggest lesson from this project was simple:
A dashboard shouldn't just look good. It should make the underlying data easier to understand and act upon.
I’m also available for dashboard projects.
If you have Excel, CSV, or other business data that is difficult to analyze, I can help transform it into a clean, professional and interactive dashboard.
Services I can provide:
→ Power BI Dashboard Development
→ Excel Dashboard Development
→ Data Cleaning & Transformation
→ Power Query Automation
→ DAX & KPI Development
→ Business / Sales Analytics
→ Interactive Reporting Systems
Check the github Repo
https://github.com/lokeshyadavalli001-star/ARTHADRSTI
Whether you need a dashboard built from scratch, an existing report improved, or messy data transformed into something usable, I'm open to working on it.
Have a dataset or reporting problem?
Send me a message. Let's turn the data into something useful.
#PowerBI #DataAnalytics #BusinessIntelligence #PowerQuery #DAX #Excel #DashboardDesign #DataVisualization #DataCleaning #FreelanceDataAnalyst

Any Suggestions and improvements is Sincerely Appreciated
Git hub Repo
https://github.com/lokeshyadavalli001-star/ARTHADRSTI

github.com
GitHub - lokeshyadavalli001-star/ARTHADRSTI: Amazon Sales Intelligence & Business Performance System
Amazon Sales Intelligence & Business Performance System - lokeshyadavalli001-star/ARTHADRSTI

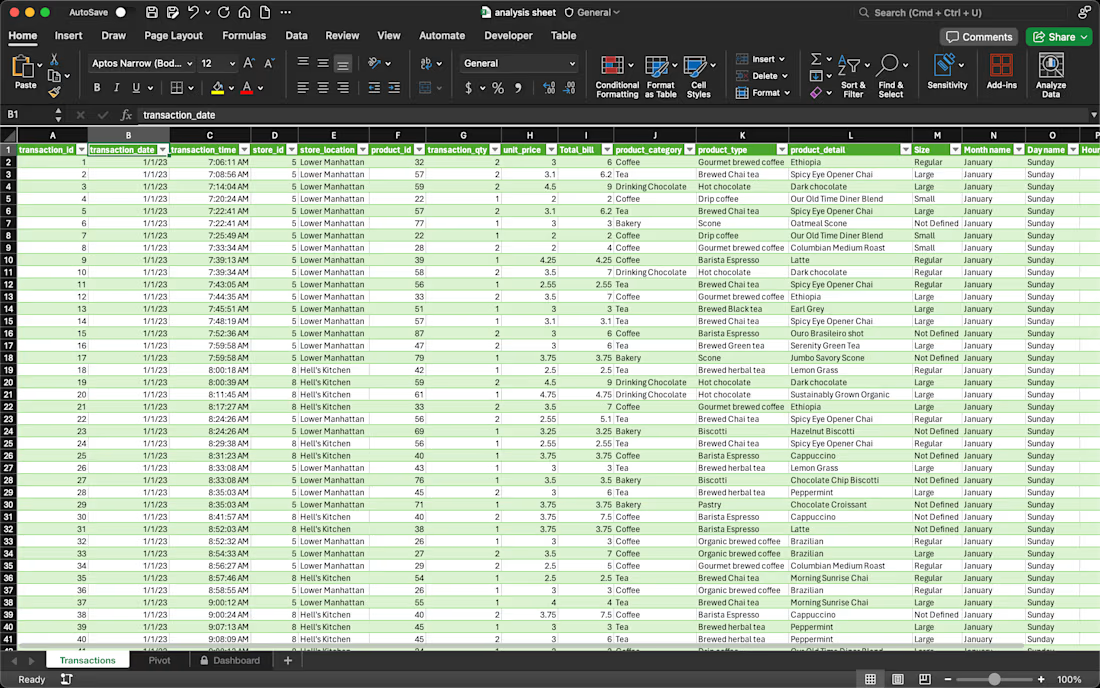
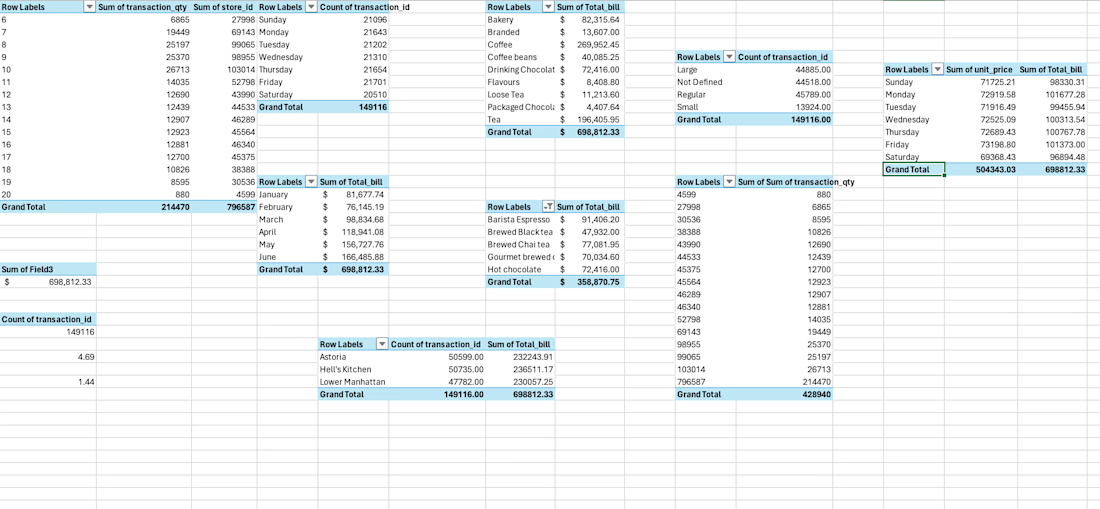
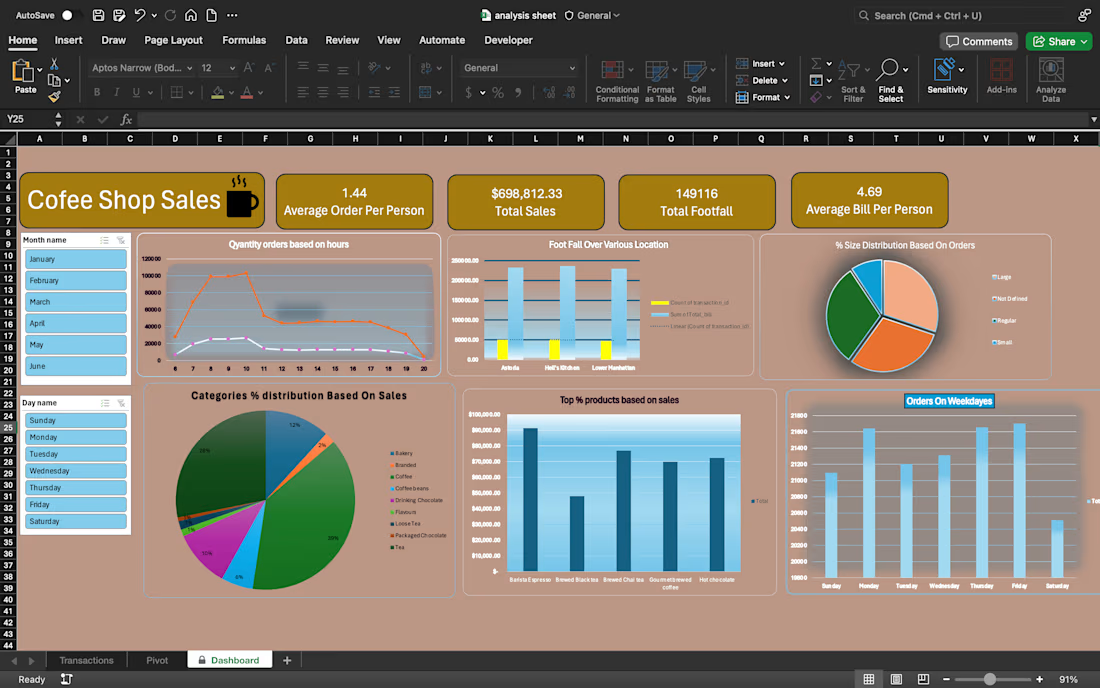
This Excel workbook contains data related to coffee shop sales, analyzing transactions, sales, and customer footfall over different locations and times. The workbook consists of three primary sheets:
Transactions Sheet: Contains raw transaction data.
Pivot Sheet: Summarizes data using pivot tables.
Dashboard Sheet: Visualizes key insights and allows for interactive data analysis.