The network for creativity
Join 1.25M professional creatives like you
Connect with clients, get discovered, and run your business 100% commission-free
Creatives on Contra have earned over $150M and we are just getting started
Back to feedPost
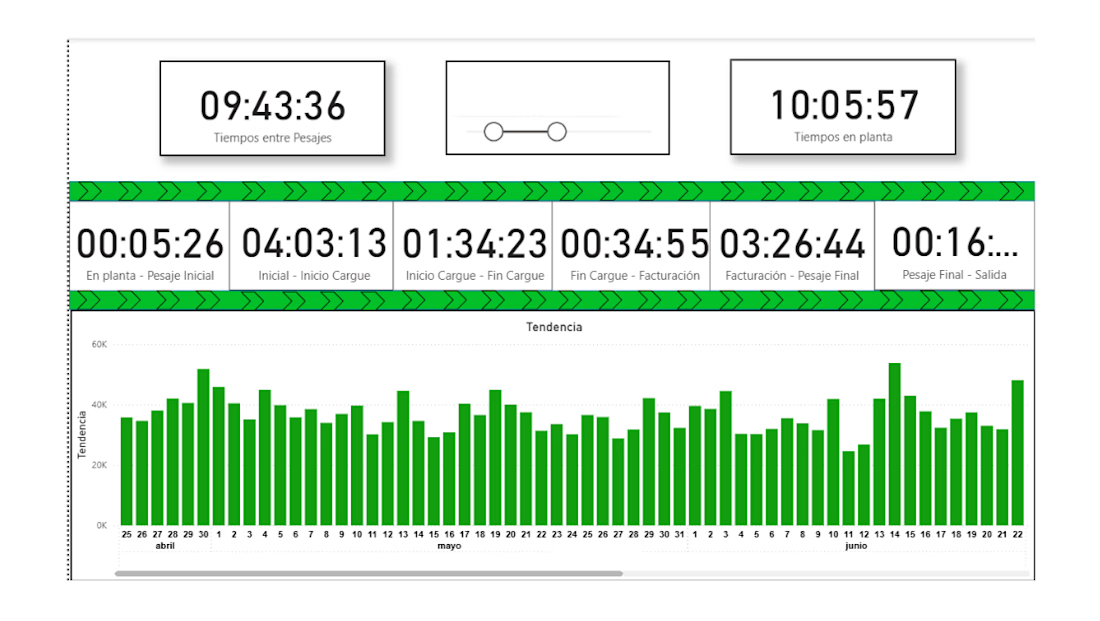
Engineered a Power BI dashboard to track the average in-plant dwell time of logistics vehicles across different operational stages. By featuring dynamic filters for date, vehicle type, and specific processes, the tool allowed operations teams to pinpoint exact bottlenecks and monitor daily performance trends. This data visualization directly supported strategic decisions to streamline internal workflows and reduce wait times. Tools: Power BI, Excel.


The network for creativity
Join 1.25M professional creatives like you
Connect with clients, get discovered, and run your business 100% commission-free
Creatives on Contra have earned over $150M and we are just getting started





Related posts

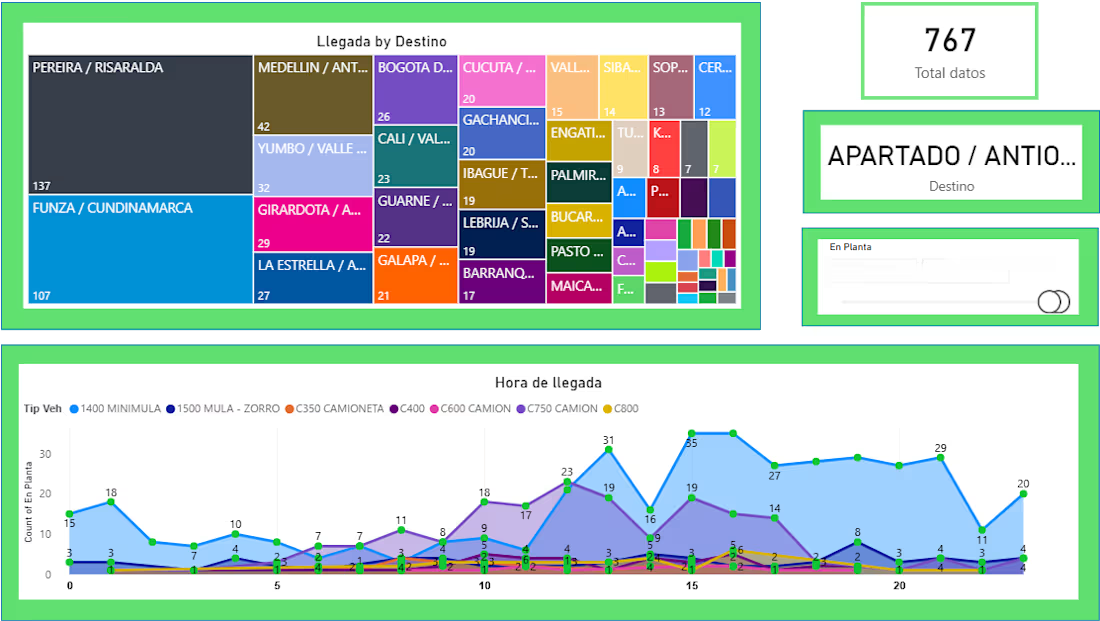
Logistics & Fleet Tracking Dashboard Built an interactive Power BI dashboard to analyze vehicle arrival times and delivery destinations for a manufacturing supply chain. By visualizing peak arrival hours by vehicle type and mapping volume distribution across regions, this tool enabled the operations team to identify bottlenecks, optimize fleet scheduling, and make data-driven decisions. Tools: Power BI, Excel.

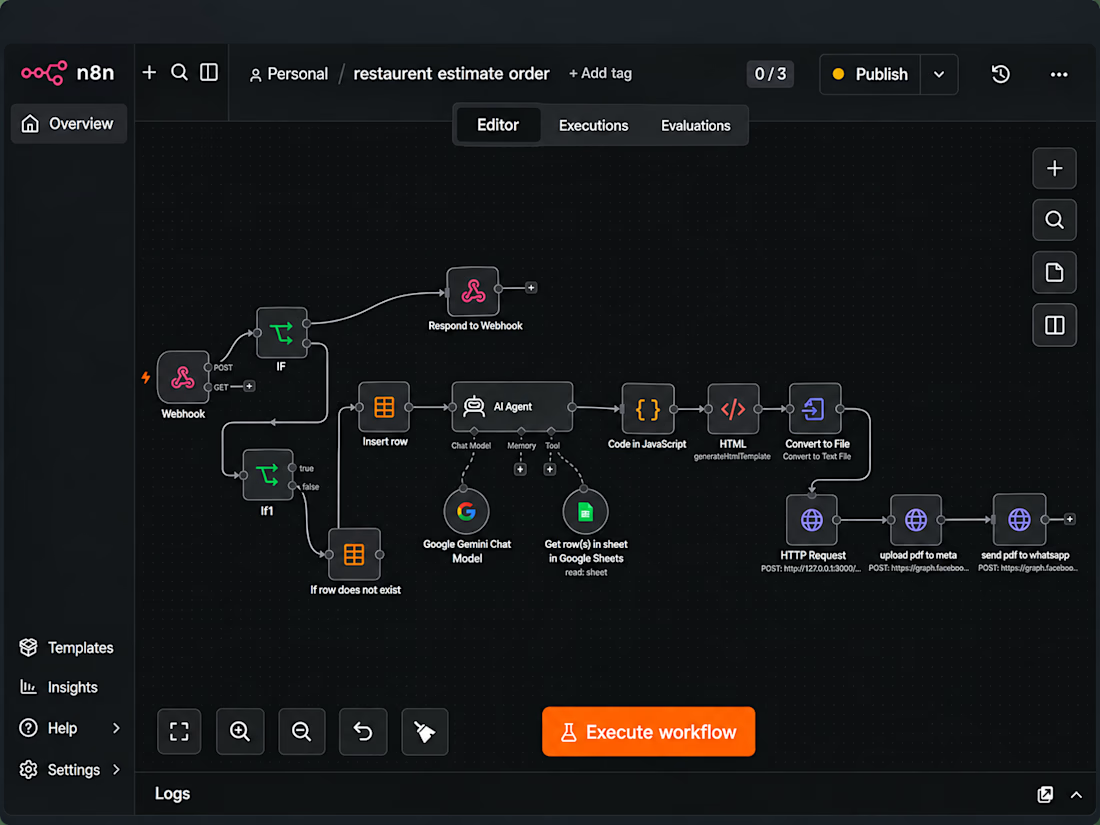
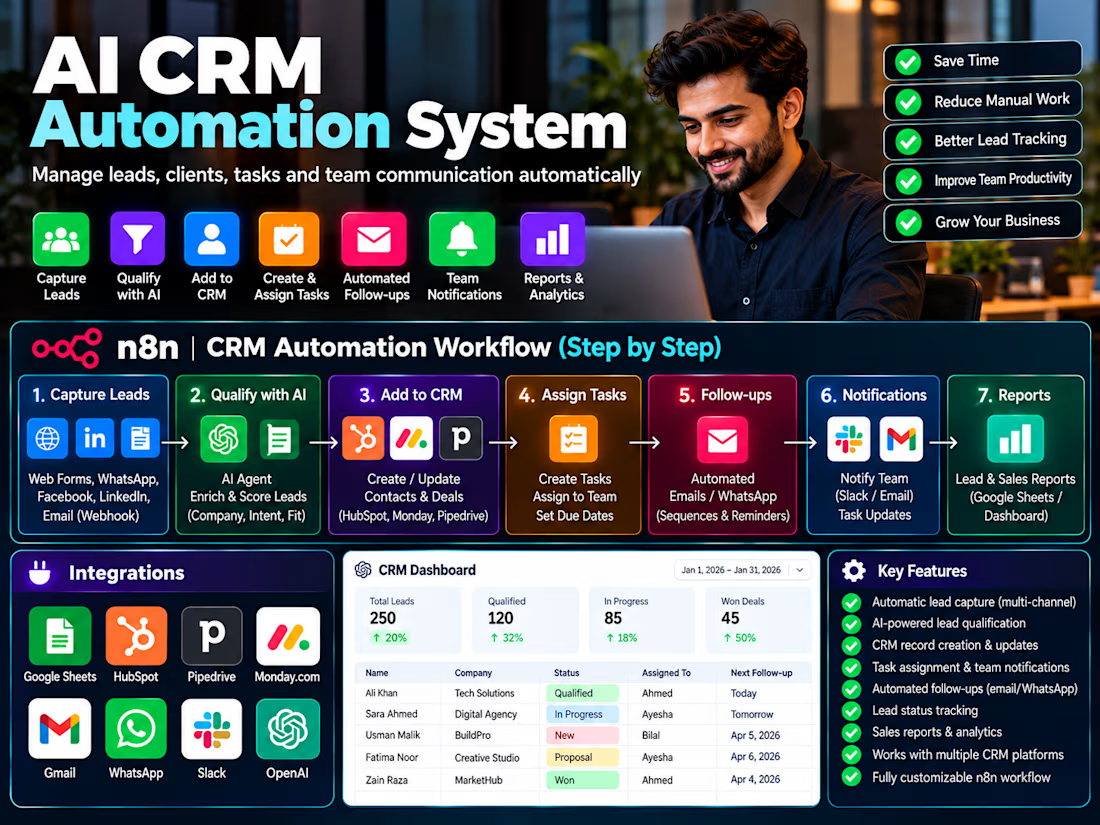
Built an n8n CRM automation system that captures leads, creates and updates CRM records, assigns tasks, sends team notifications, automates follow-ups and generates reports.


Restaurant Automation System. Automates WhatsApp orders, menu & pricing lookup, estimate generation, PDF invoices, and order processing using n8n, Google Sheets, Gemini AI and WhatsApp Cloud API.