The network for creativity
Join 1.25M professional creatives like you
Connect with clients, get discovered, and run your business 100% commission-free
Creatives on Contra have earned over $150M and we are just getting started
Back to feedPost

🚀 Transforming Google Sheets Data into Custom Power BI Intelligence! 🚀
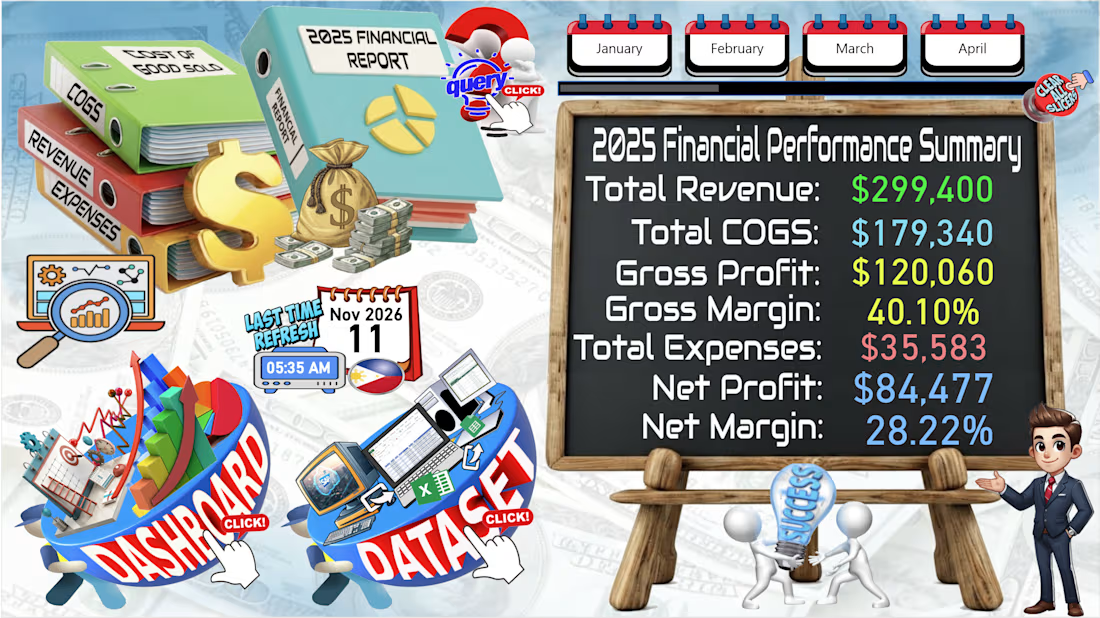
Tired of plain, uninspiring spreadsheets? Check out my latest Interactive Financial Performance Dashboard—where advanced data modeling meets high-end UI design. By combining Power BI with custom assets crafted in Photopea, I turned a standard Google Sheets cloud source into a functional, gamified web app.
🛠️ Dashboard Features
☁️ Live Cloud Integration: Syncs automatically with your Google Sheets data.
🎨 Bespoke UI Design: Custom visual containers and themes made in Photopea.
📋 Seamless Navigation: Fully clickable buttons to switch between views and return home.
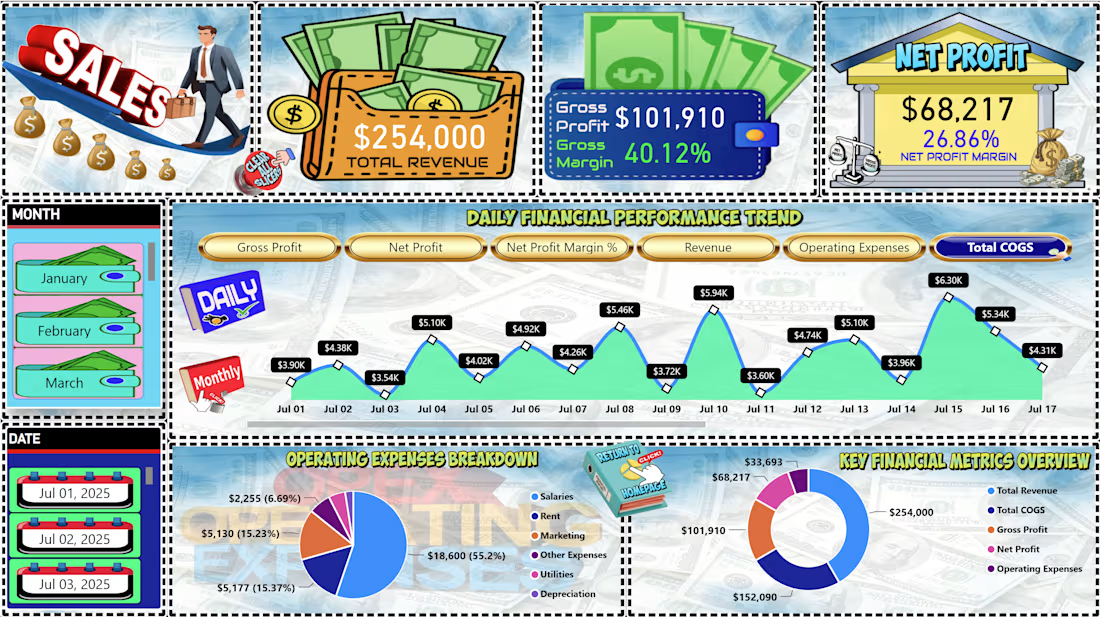
📉 Dual-Layer Trends: Toggle daily and monthly views for revenue, expenses, and COGS.
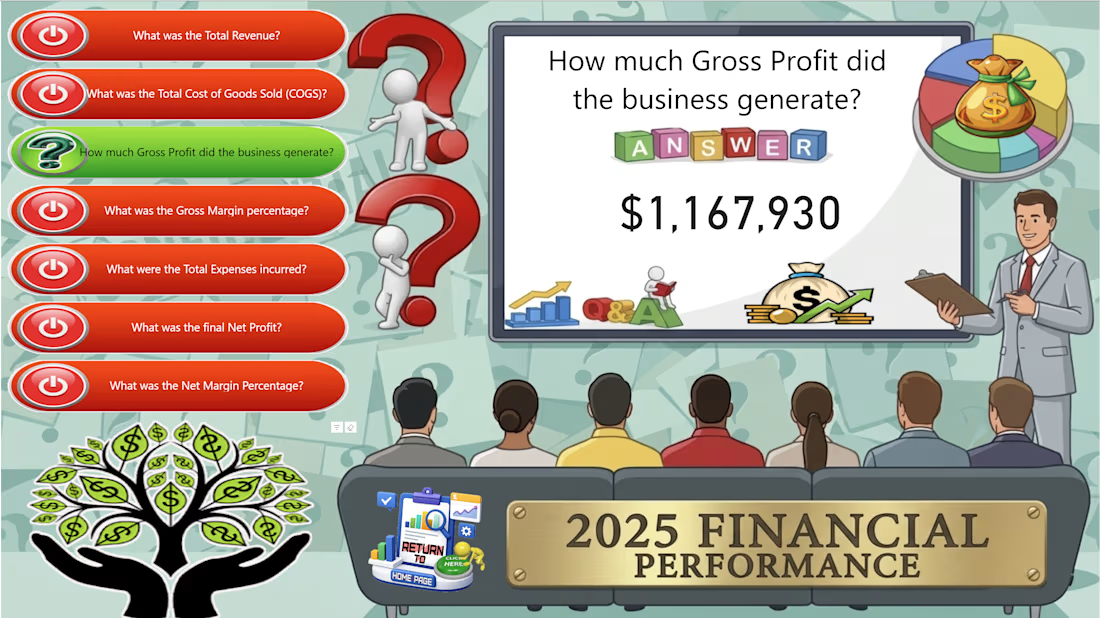
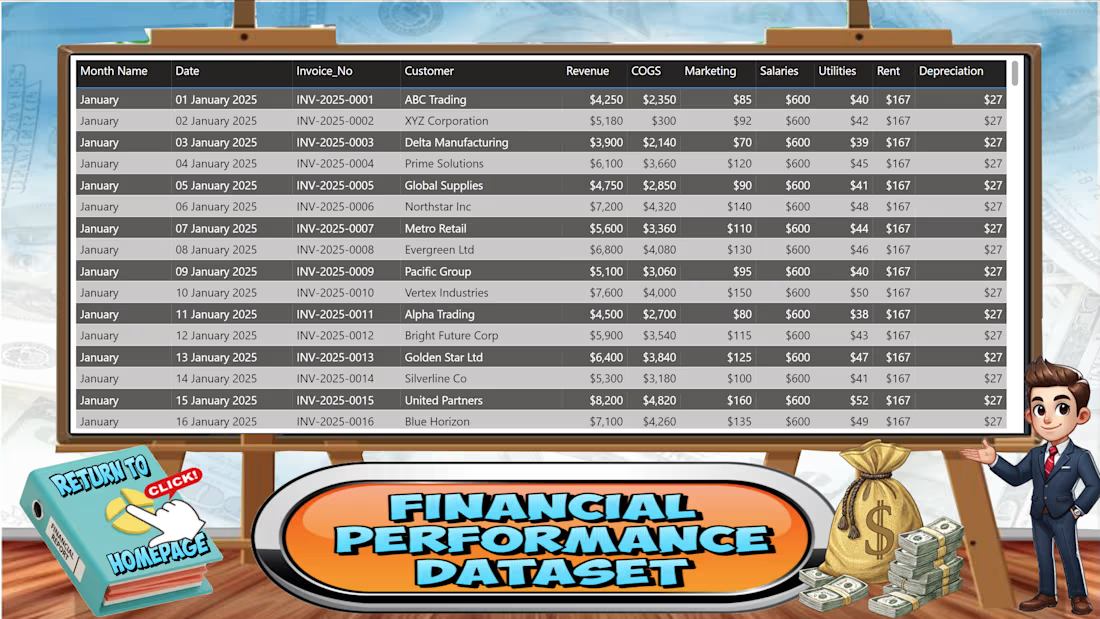
📊 Dataset & Q&A Board: View raw tabular data or click pre-set questions for instant answers (like the overall $1,167,390 Gross Profit screen).
The network for creativity
Join 1.25M professional creatives like you
Connect with clients, get discovered, and run your business 100% commission-free
Creatives on Contra have earned over $150M and we are just getting started





Related posts

Hello Contra community! 👋
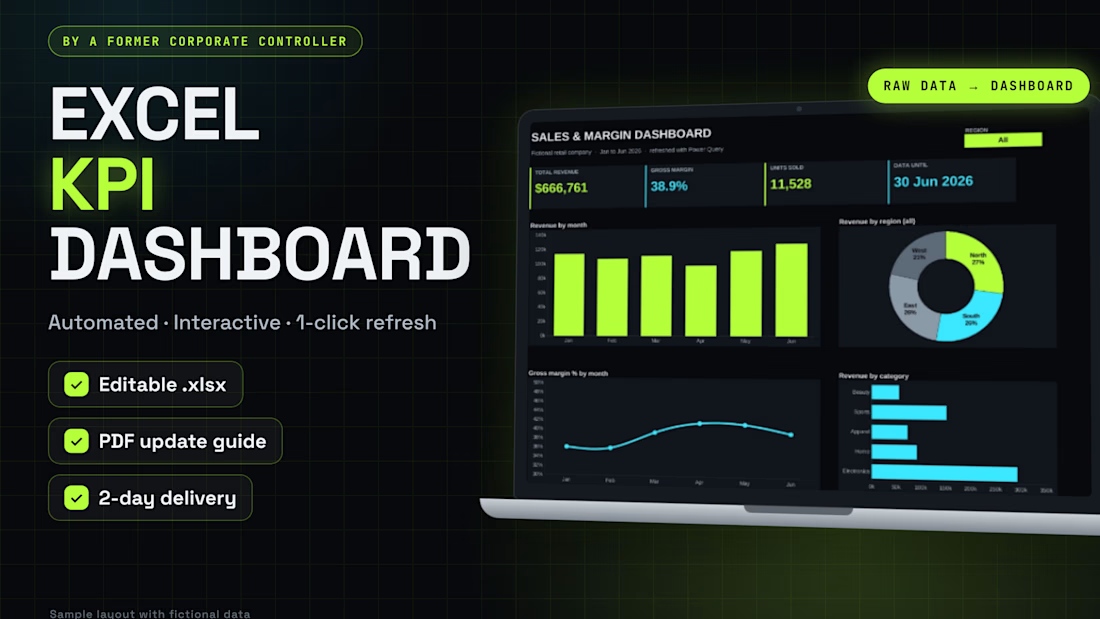
I'm Renata, a former corporate controller from Brazil. Until October 2026 I ran the finance and tax areas of an industrial company, so I know what happens when the numbers live in 15 different spreadsheets.
Now I help small businesses turn messy spreadsheets into clean Excel and Power BI dashboards that show, in one screen, where the money goes.
What I do: Excel dashboards and automation (Power Query) • Power BI reports • budgets and cost analysis • investor-ready presentations.
What's the one number you check first in your business every morning?


Welcome to Contra 🙌

📈 Your data deserves more than a spreadsheet.
A well-designed dashboard can help turn complex datasets into information that's easier to explore and understand.
I'm now offering Power BI Dashboard Development on Contra.
My service includes:
• Data preparation and transformation
• KPI development
• Interactive dashboards
• Charts, filters and slicers
• Basic documentation
If you're looking to make better use of your business data, let's connect!
Explore the service: https://contra.com/s/gc2X2Eoe-power-bi-dashboard-development-or-interactive-bi
#PowerBI #BusinessIntelligence #DataAnalytics #DashboardDesign #Contra

contra.com
Power BI Dashboard Development | Interactive BI by Ritika Talwar
Read more about Power BI Dashboard Development | Interactive BI by Ritika Talwar on Contra.


5 signs your team has outgrown its spreadsheet 👇
Three versions of the same file. “Orders_final_v2” vs “Orders_FINAL_use_this”. Nobody knows which one is right.
Copy-paste between sheets. Every copy is a chance for a #REF! error.
Everyone can edit everything. One wrong click and 70 rows are gone.
It takes forever to open. Your team waits before they can even start working.
Reports are rebuilt by hand. Someone loses hours every week making the same chart.
Quick rule: 1 or 2 of these? Keep the spreadsheet. 3 or more? It’s quietly costing you more than a simple dashboard would.
How many of these does your team have? 👇

Those duplicate files are a clear sign.