The network for creativity
Join 1.25M professional creatives like you
Connect with clients, get discovered, and run your business 100% commission-free
Creatives on Contra have earned over $150M and we are just getting started
Back to feedPost
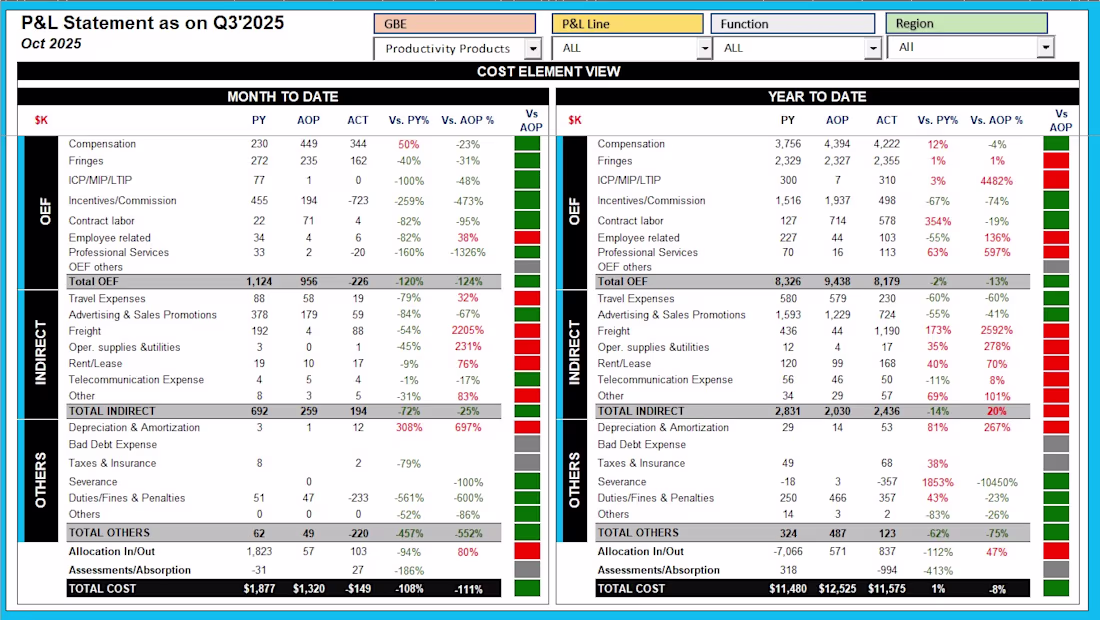
Designed an automated P&L variance analysis dashboard for FP&A and finance teams to quickly analyze month-to-date and year-to-date performance across OEF, Indirect, and Other cost categories.
This dashboard helps finance leaders:
Compare PY vs AOP vs Actuals in real-time
View variance %, color-coded performance indicators, and drilldowns
Track trends across regions, functions & P&L lines
Improve month-end review speed and decision-making
Built entirely in Excel using dynamic formulas (SUMIFS, INDEX/MATCH, conditional formatting) and automated data refresh logic.
Outcome for client: Faster variance storytelling, improved accuracy, and a clean CFO-ready view of performance.
The network for creativity
Join 1.25M professional creatives like you
Connect with clients, get discovered, and run your business 100% commission-free
Creatives on Contra have earned over $150M and we are just getting started
Trending
Claude
Claude has entered the design space. How are you using Claude Design?
Contra University
Learn from expert creatives how to earn more using next-gen AI tools.
creativeaiflow
Creative AI workflows are evolving. What tools do you use, and what are their strengths and weaknesses?
portfolioreview
The best portfolios tell a story, not just show a grid. Share yours for feedback.
freelancerlife
Freelancer life is wins, pivots, and everything in between. What’s yours right now?