The network for creativity
Join 1.25M professional creatives like you
Connect with clients, get discovered, and run your business 100% commission-free
Creatives on Contra have earned over $150M and we are just getting started
Back to feedPost
Profit and Loss sample
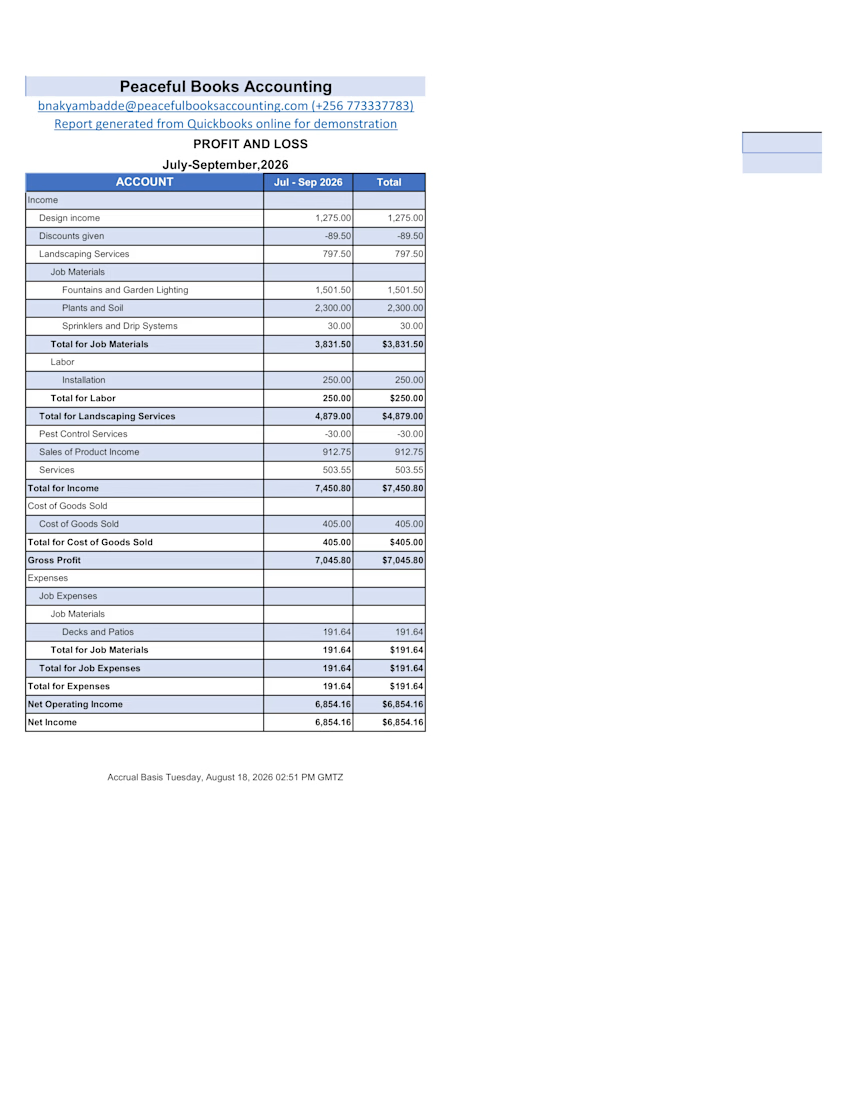

Sample Profit and Loss report generated in Quickbooks online(QBO) for July-September 2026 using demo data.Part of my month -End close Sample pack.
What I did:Closed up and categorised income:Landscaping services,design income and job materials. I classified Cost of Goods sold:Job...
The network for creativity
Join 1.25M professional creatives like you
Connect with clients, get discovered, and run your business 100% commission-free
Creatives on Contra have earned over $150M and we are just getting started
Related posts

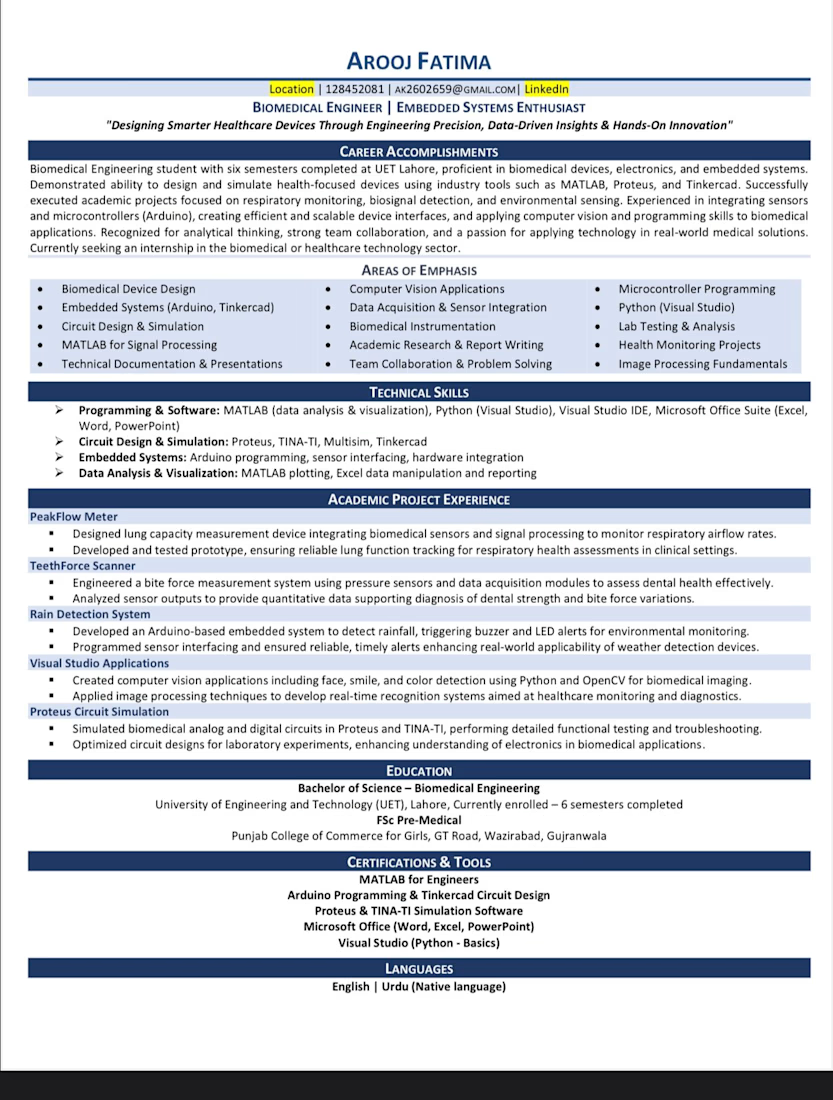
Resume sample

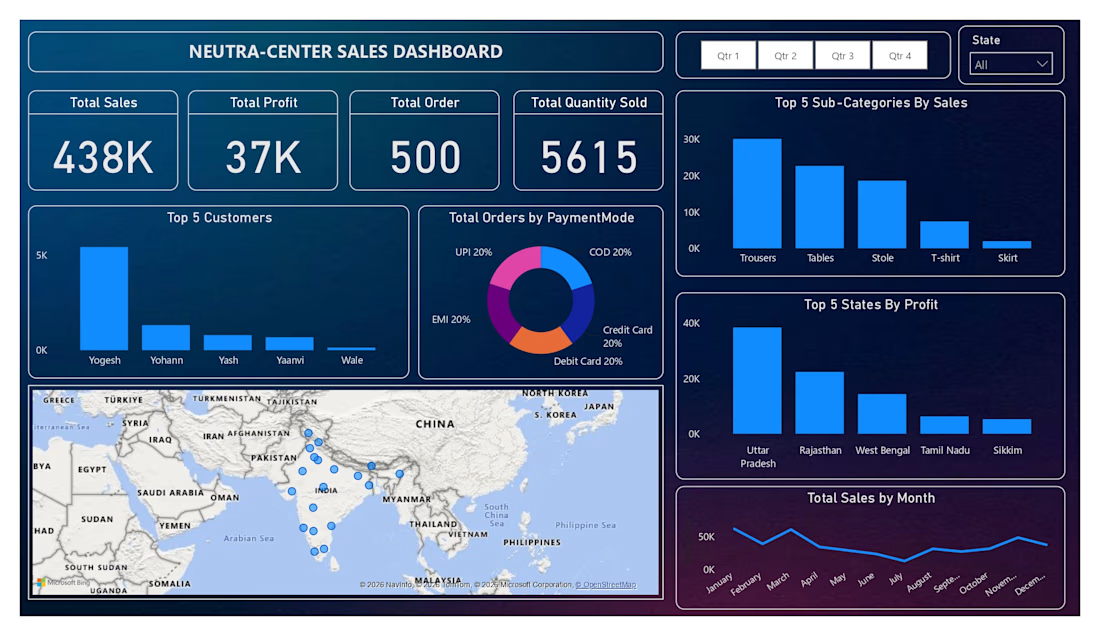
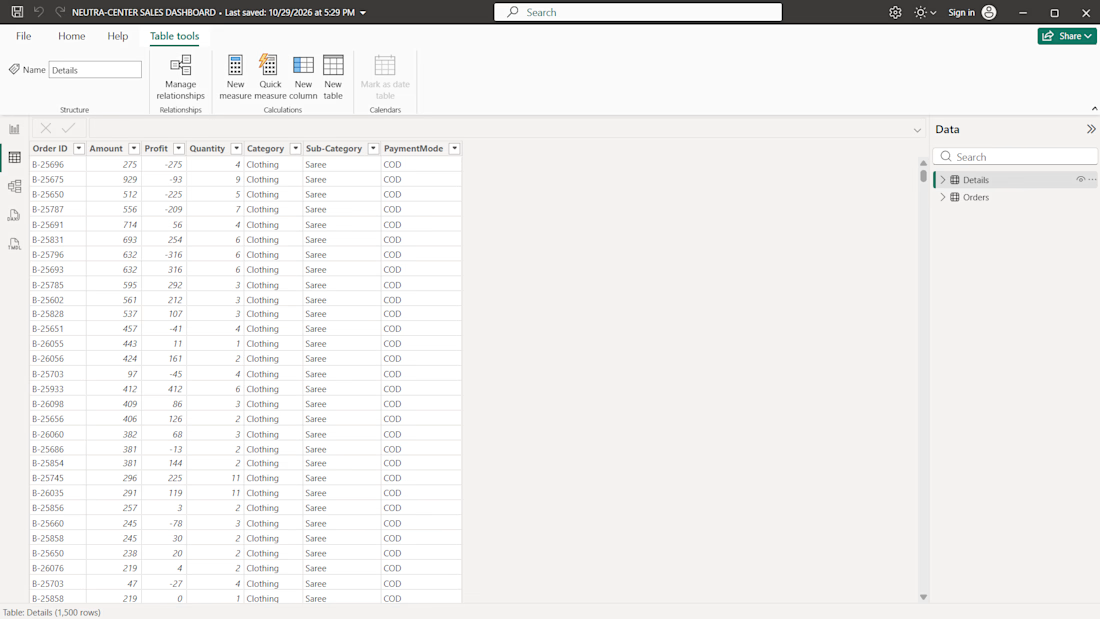
I created an interactive "Neutra-Center Sales Dashboard using Microsoft Power BI" to transform sales excel data into clear, meaningful business insights.
Key Features:
- Interactive quarterly and state filters
- Sales and profit KPI cards
- Customer and product performance analysis
- Payments method distribution
- State-wise profit coparison
- Monthly sales trend visualization
- Geographic sales distribution map
- Clean, modern dashboard design
This project demonstrates my ability to present sales data in an organized, interactive, and visually appealing format to help user understand business performance and identify important trends.



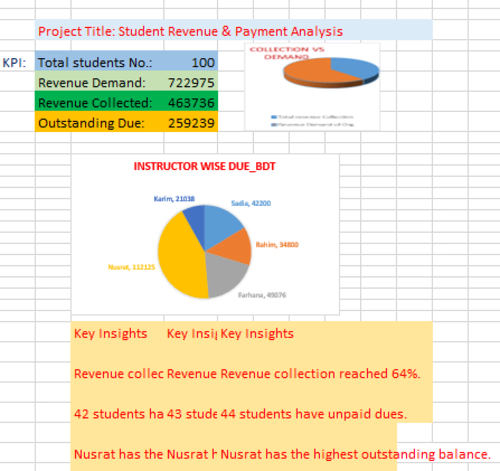
Analyzed a dataset of 100 students using Microsoft Excel to evaluate revenue collection, outstanding payments, and instructor-wise performance. Created charts and a dashboard to visualize key findings and provide actionable recommendations for improving payment recovery.