The network for creativity
Join 1.25M professional creatives like you
Connect with clients, get discovered, and run your business 100% commission-free
Creatives on Contra have earned over $150M and we are just getting started
Back to feedPost

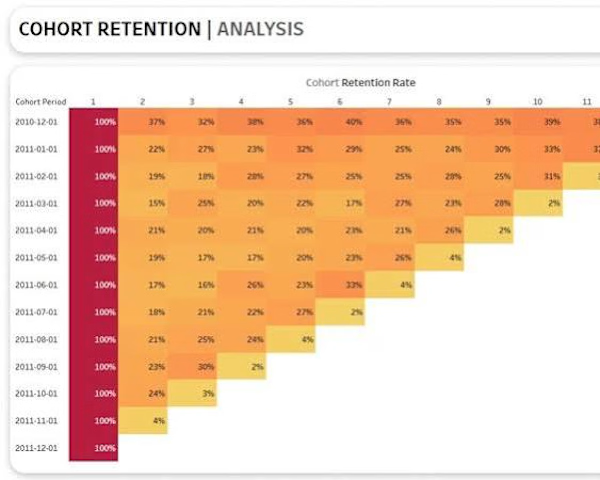
End-to-End Retention Funnel & User Cohort Analytics


The network for creativity
Join 1.25M professional creatives like you
Connect with clients, get discovered, and run your business 100% commission-free
Creatives on Contra have earned over $150M and we are just getting started




Related posts

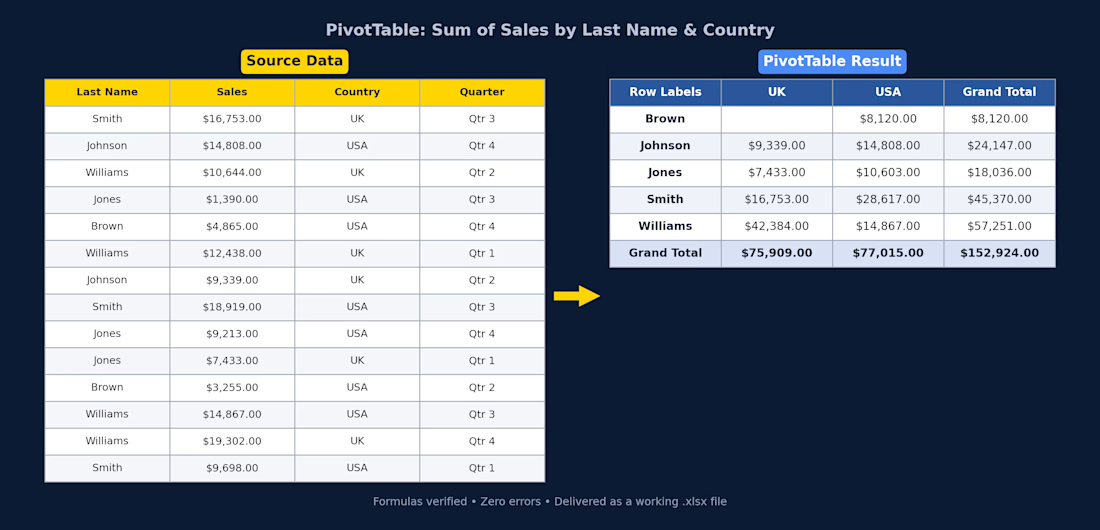
Excel PivotTable — Sales Summary
Client had raw sales data (14 rows across UK/USA, split by quarter) and needed it turned into something actually usable. I cleaned it up and built a PivotTable that breaks total sales down by rep and country, with grand totals for both.
What I did:
Structured the raw data into a proper table (consistent headers, currency formatting)
Built a PivotTable summarizing Sum of Sales by Last Name and Country
Used SUMIFS so the totals update automatically if the source data changes — nothing hardcoded
Checked every formula for errors before delivery
Delivered as a working .xlsx file, ready to plug into a bigger report or dashboard.
If you've got messy sales/ops data sitting in a spreadsheet and need it turned into something you can actually read at a glance, this is exactly the kind of thing I can help with.


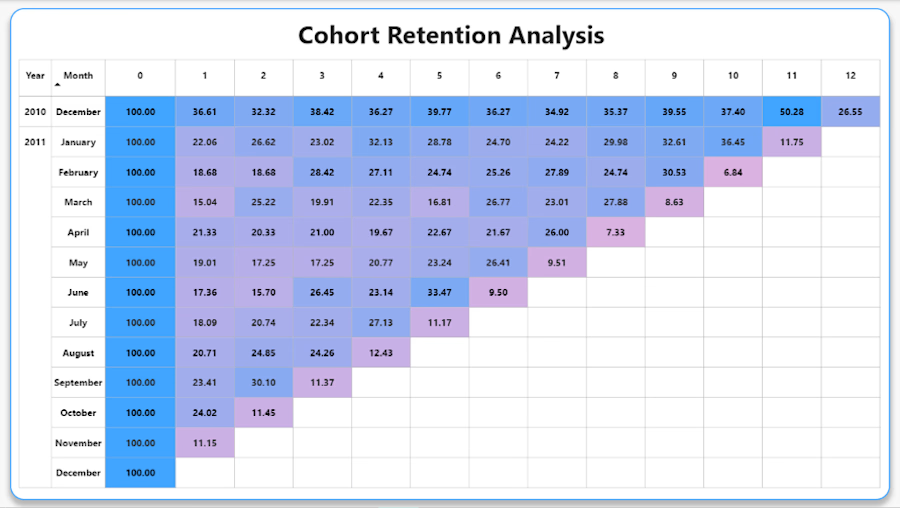
RFM Segmentation & Cohort Retention Analysis
Paired RFM segmentation with month-over-month cohort retention. 265 “Champion” customers generate $5.7M — more than every other segment combined — and retention drops off a cliff after month 1 but stabilizes into a distinct “core repeat” base afterward.


AI Data Assistant Inside Power BI
I built an AI-powered chatbot directly inside Power BI to help users interact with their existing dashboards and data through natural-language questions.
Instead of manually opening multiple dashboards to find a specific metric, users can ask the assistant a business question and receive a data-grounded answer along with the relevant report/dashboard source.
The assistant works across multiple Power BI dashboards and can provide context from the available reports, making it easier to find insights without changing the existing BI environment.
Key capabilities:
- Ask questions directly inside Power BI
- Connect with existing Power BI data
- Search across dashboards and reports
- Get relevant metrics and insights
- Identify the source report/dashboard
- Answer data-driven business questions
- Work within existing BI infrastructure
- Add a conversational layer to Power BI
