The network for creativity
Join 1.25M professional creatives like you
Connect with clients, get discovered, and run your business 100% commission-free
Creatives on Contra have earned over $150M and we are just getting started
Back to feedPost

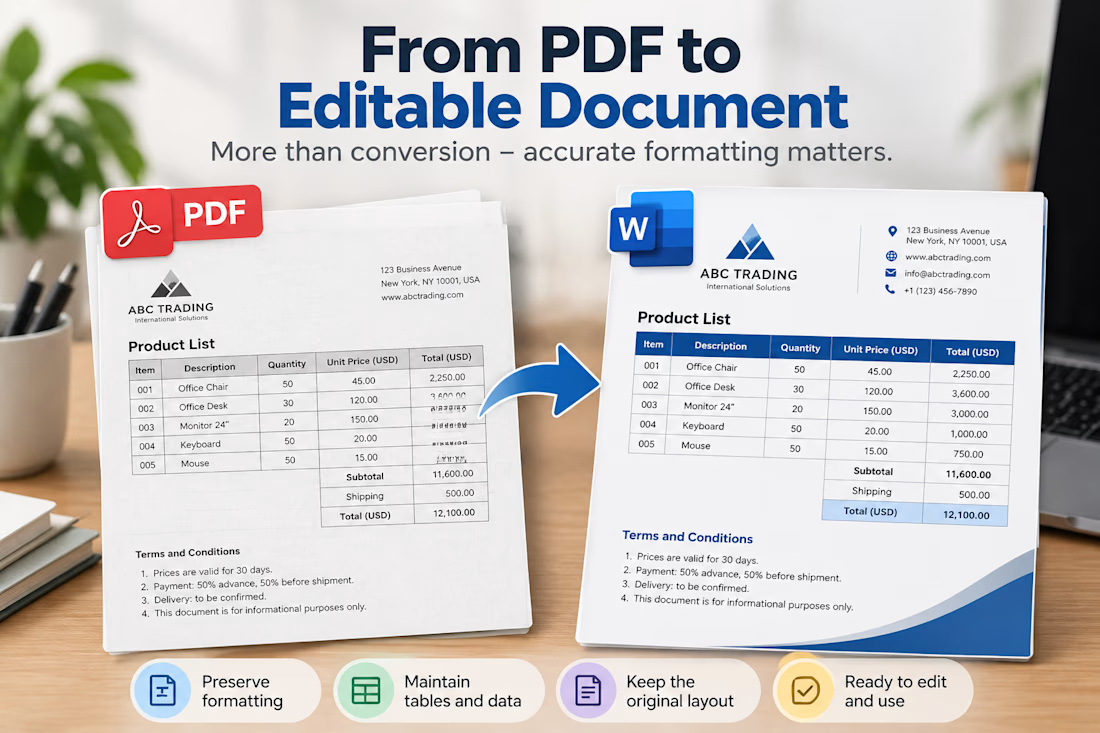
📄 From PDF to Editable Document: What Makes a Good Conversion?
Working with PDF files isn't always as simple as clicking "Convert" 📄
A good conversion should preserve more than just the text. Tables, headings, spacing, alignment, page structure, and overall readability also matter.
When converting a PDF into an editable Word or Excel file, I always look at:
📑 Document structure and hierarchy
📊 Tables and organized data
🔤 Fonts, spacing, and alignment
📐 Page layout and consistency
🔎 Overall accuracy after conversion
The goal isn't just to create an editable file - it's to create a file that is actually ready to use.
Have you ever converted a PDF and ended up spending more time fixing the formatting than expected?

The network for creativity
Join 1.25M professional creatives like you
Connect with clients, get discovered, and run your business 100% commission-free
Creatives on Contra have earned over $150M and we are just getting started





Related posts

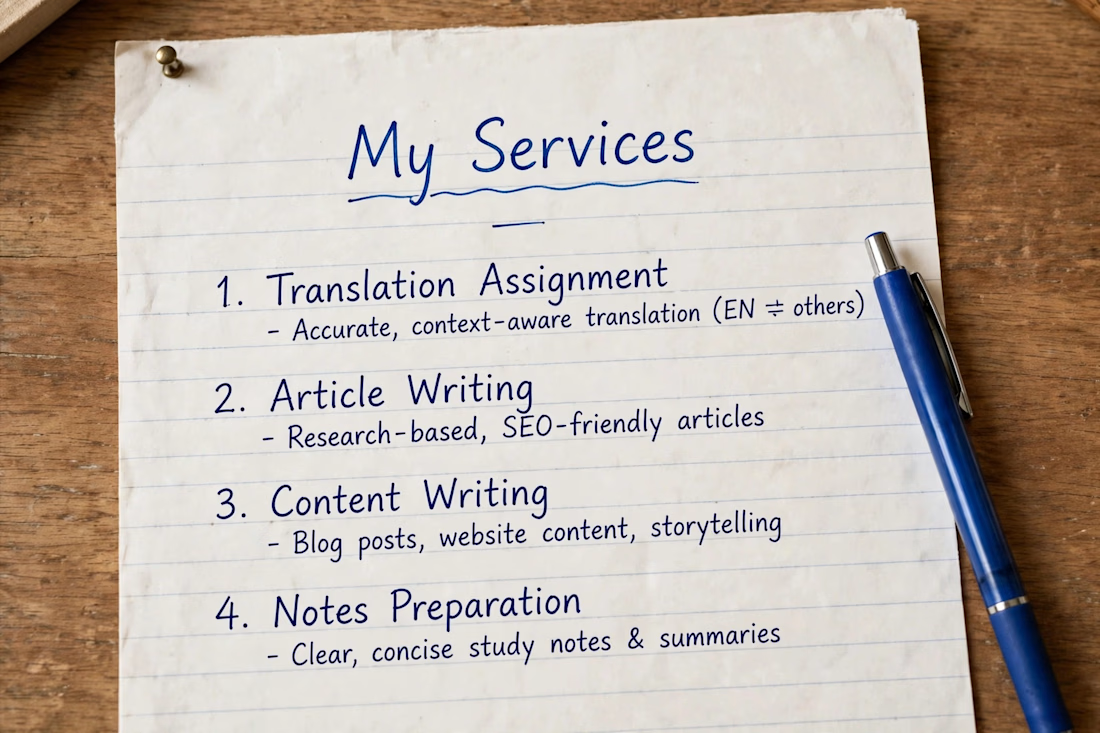
content writing Translation assignment article writing hand written YouTube channel script and story



Can you please tell me the details of the work I'm interested in typing work

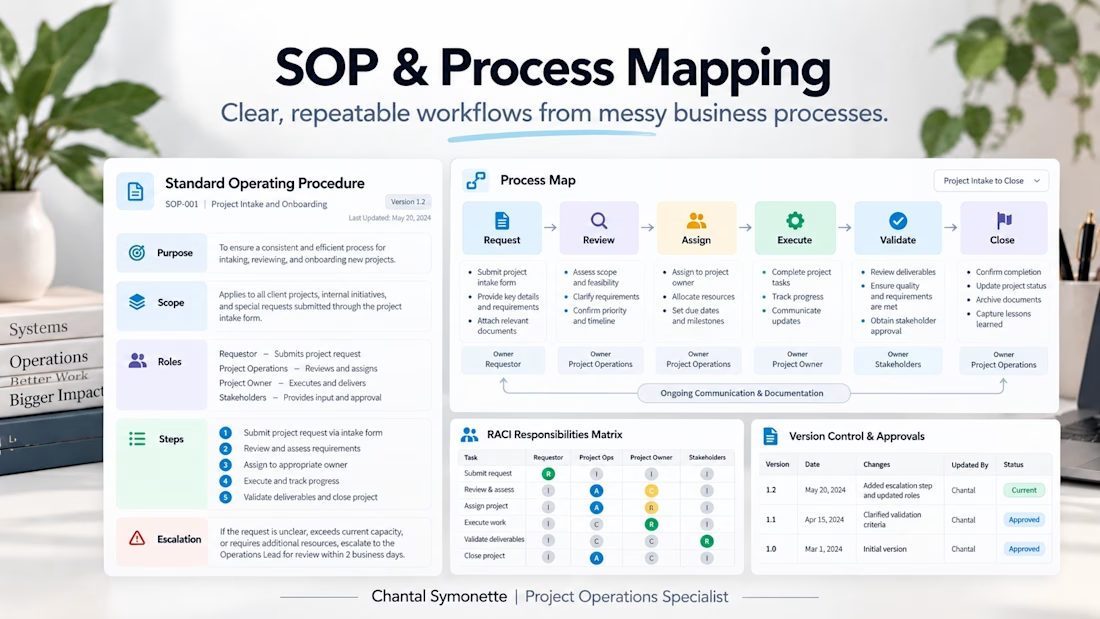
A structured SOP and process map designed to turn inconsistent workflows into clear, repeatable processes. This shows defined roles, process steps, escalation guidance, responsibilities, and version control to improve consistency and accountability.



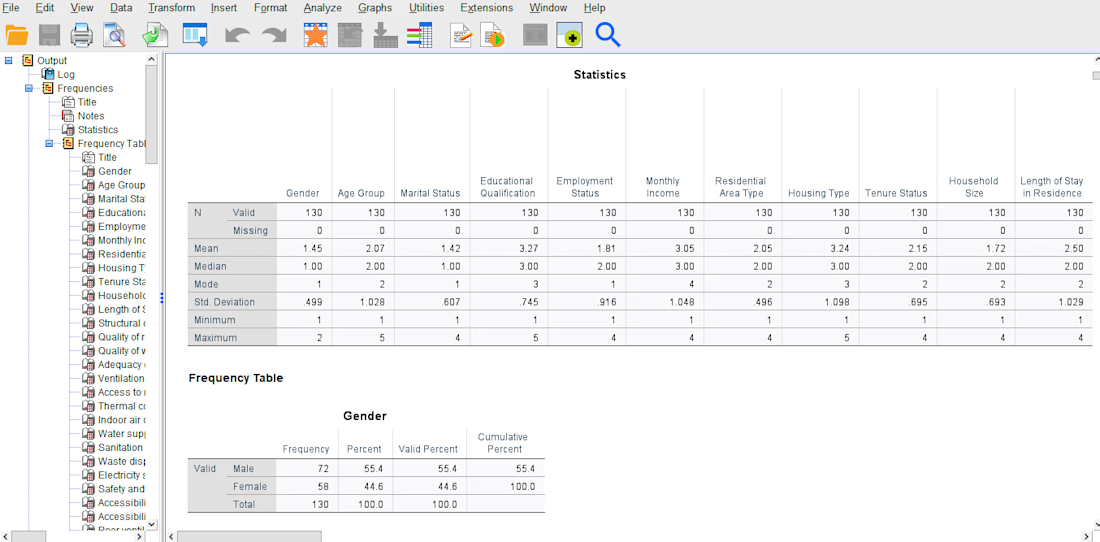
SPSS Statistical Analysis – Descriptive Statistics & Frequency Report
Description:
Project Overview: Analysis of 130 survey responses for a research project.
What I delivered: Full descriptive statistics in SPSS: N, Mean, Median, Mode, Std. Deviation, Min/Max for 11 variables (Gender, Age, Marital Status, Education, Employment, Income, Housing, etc.)
Frequency tables with percent, valid percent, cumulative percent – e.g., Gender distribution (Male 55.4%, Female 44.6%)
Clean, publication-ready SPSS output tables for thesis/dissertation chapter 4Interpretation-ready results for RII and demographic profiling
Many researchers can collect data but get stuck at SPSS output. I turn their coded data into tables they can directly paste into their project.
Privacy: Sample output shown. Full dataset and client research topic kept confidential.