The network for creativity
Join 1.25M professional creatives like you
Connect with clients, get discovered, and run your business 100% commission-free
Creatives on Contra have earned over $150M and we are just getting started
Back to feedPost

If a CSV total looks wrong in Excel, check whether the amount column contains text. SUM ignores text cells, even when they look like currency.
Also check the import settings before opening order IDs as numbers. An ID like 000101 can lose its leading zeros.
We put together a short guide to importing CSVs, handling dates and reconciling totals, with links to Microsoft’s documentation:
https://tidemark-export-rescue.netlify.app/csv-in-excel.html
Published by Export Rescue, our CSV cleanup service.
tidemark-export-rescue.netlify.app
Why your CSV totals look wrong in Excel
Check CSV amount types, preserve order IDs, choose the correct locale, and reconcile records before trusting your Excel totals.
The network for creativity
Join 1.25M professional creatives like you
Connect with clients, get discovered, and run your business 100% commission-free
Creatives on Contra have earned over $150M and we are just getting started




Related posts

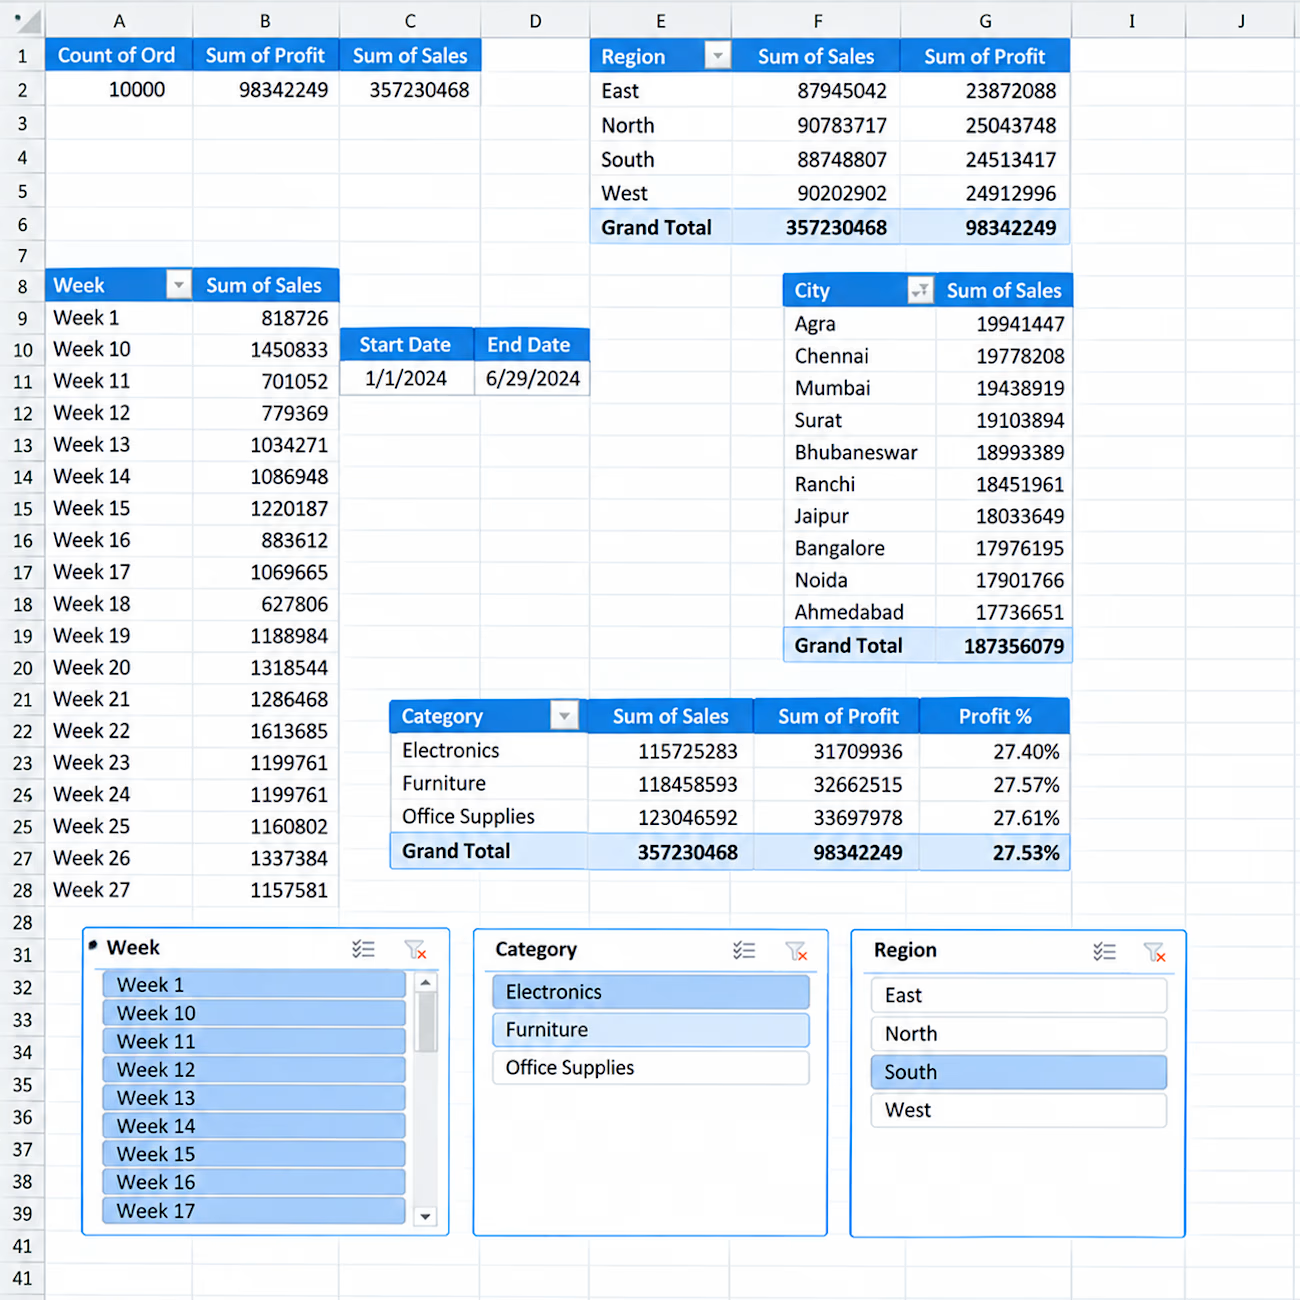
📊 Interactive Sales Analytics Dashboard in Excel
I created an interactive Excel dashboard to analyze sales performance across different business dimensions.
Key Insights & Features:
• Total Orders, Sales & Profit KPIs
• Sales & Profit by Region
• Sales by City
• Category-wise Sales, Profit & Profit %
• Weekly Sales Analysis
• Interactive Slicers for Week, Category & Region
• Start Date & End Date tracking
• PivotTable-based analysis
This dashboard is designed to turn raw sales data into clear and actionable business insights using Excel.


Hello.
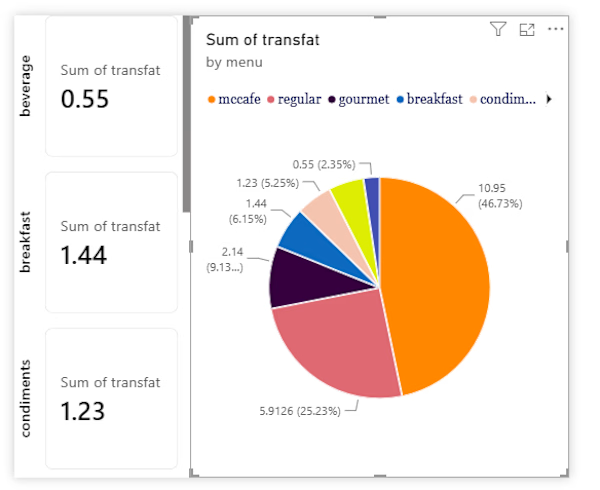
I guess we're in the same page about data analysis and visualization
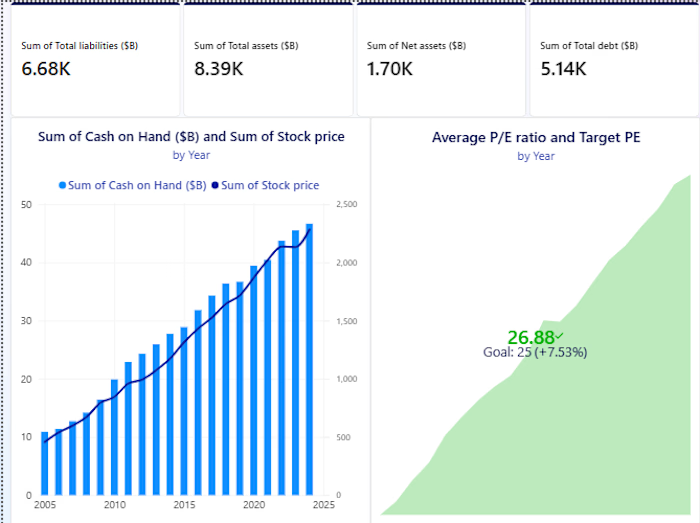

Starter Tier Project
Project name (100 characters limit)
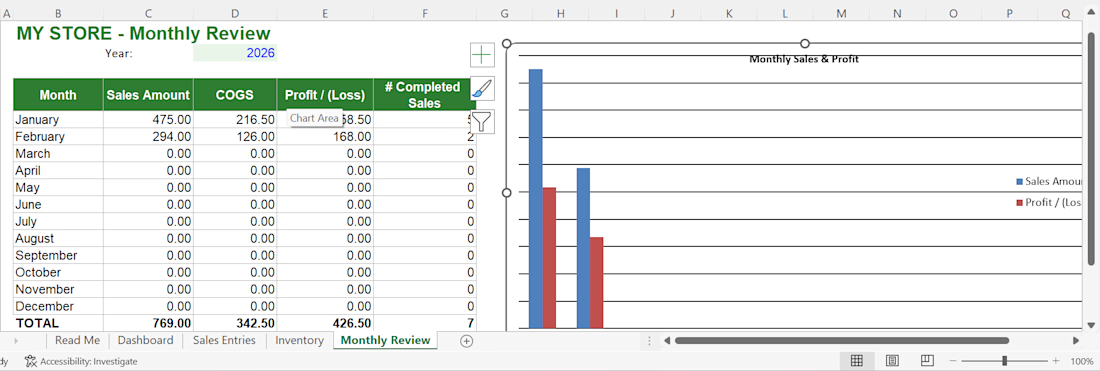
Starter E-Commerce Sales & Inventory Dashboard
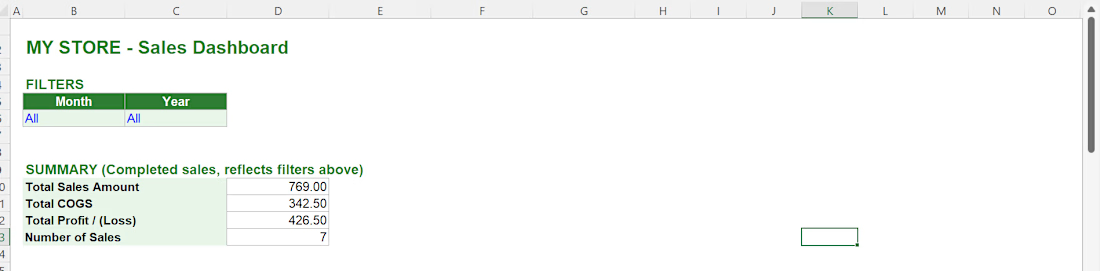
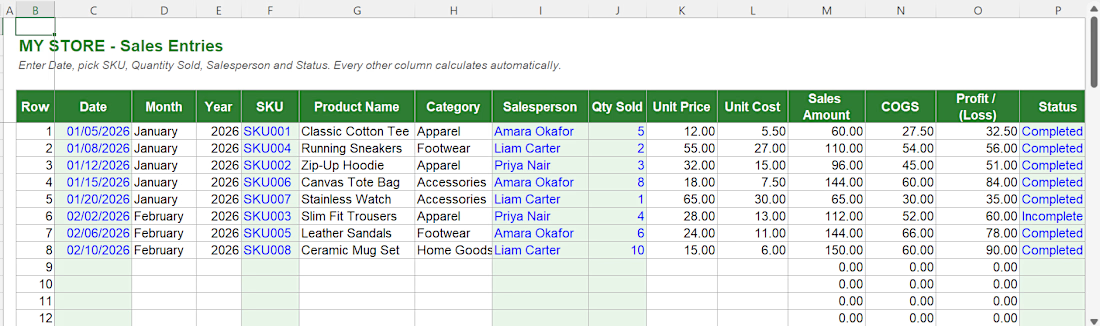
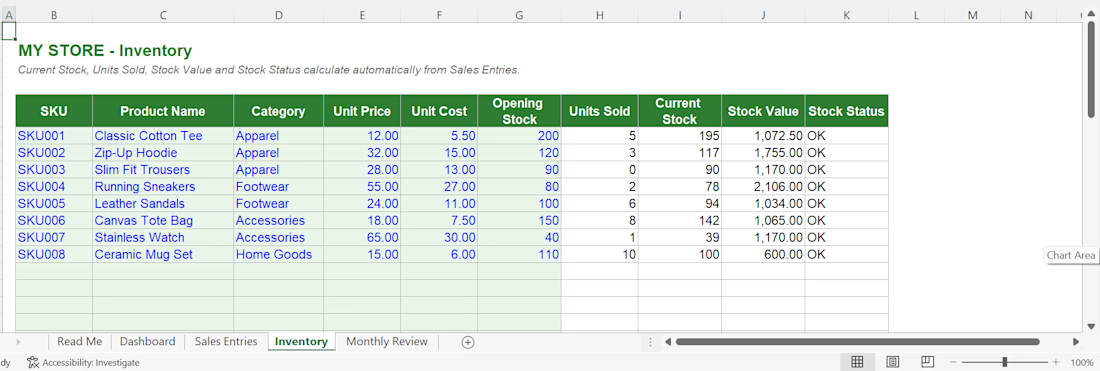

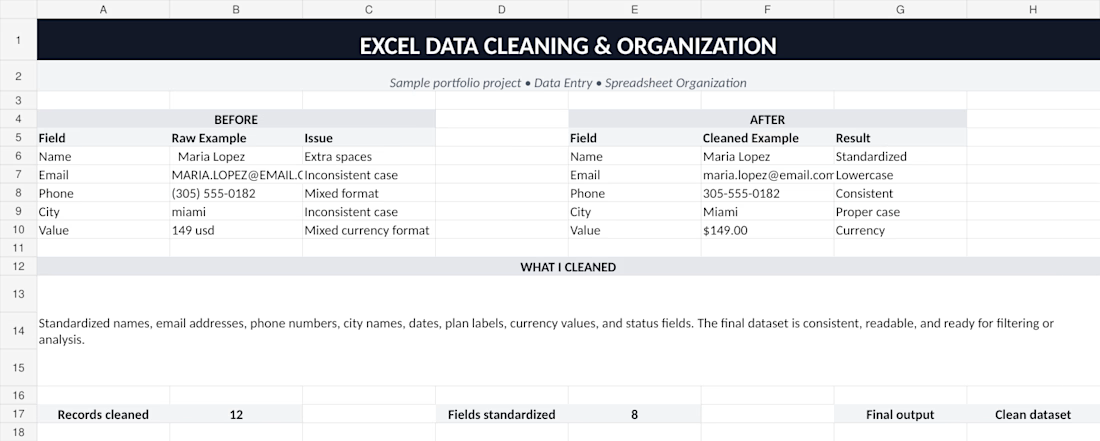
Excel Data Cleaning & Organization — Sample Project
I created this sample project to demonstrate how I clean and organize messy spreadsheet data. I standardized names, emails, phone numbers, locations, dates, categories, currency values, and status fields to create a clean, consistent dataset ready for filtering and analysis.