The network for creativity
Join 1.25M professional creatives like you
Connect with clients, get discovered, and run your business 100% commission-free
Creatives on Contra have earned over $150M and we are just getting started
Back to feedPost

Planned, Managed and Executed this event


The network for creativity
Join 1.25M professional creatives like you
Connect with clients, get discovered, and run your business 100% commission-free
Creatives on Contra have earned over $150M and we are just getting started
Related posts

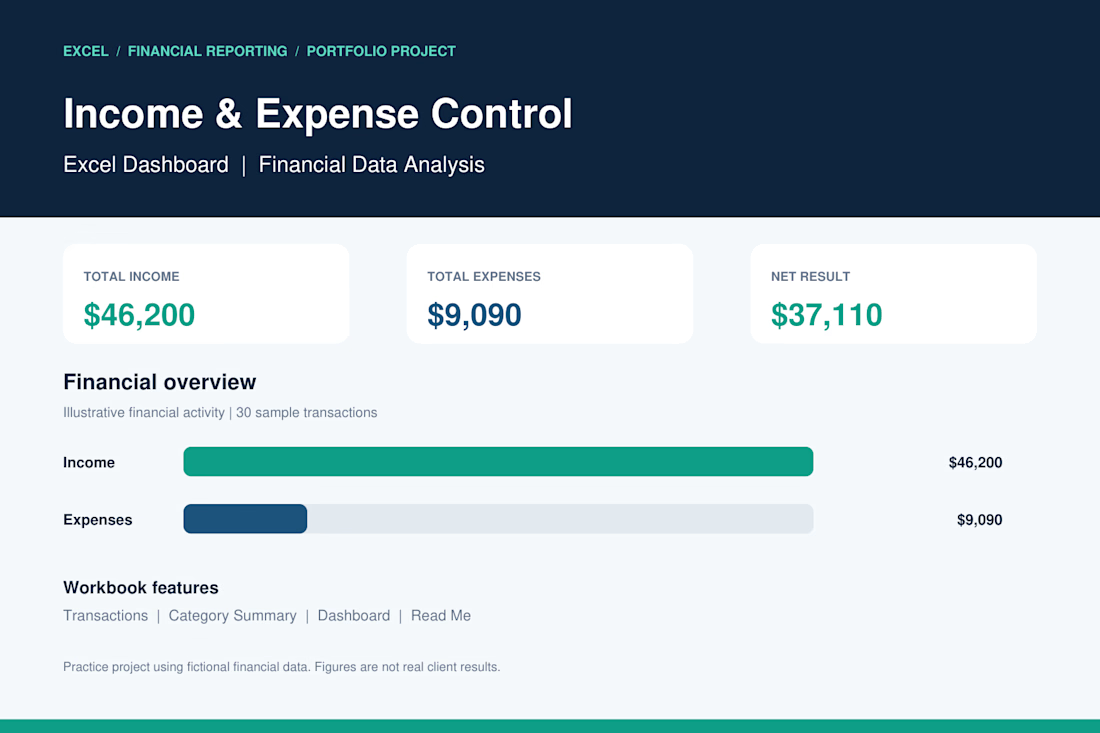
Income & Expense Control | Excel Dashboard
I developed a professional Excel dashboard as a portfolio practice project to demonstrate my skills in financial data management, income and expense tracking, and business reporting.
Project Features:
Automated income and expense calculations.
Financial dashboard with key performance indicators (KPIs).
Transaction tracking and organization.
Expense analysis by category.
Financial charts and visual reporting.
Net income calculation.
Project Results (Sample Data):
Total Income: $46,200
Total Expenses: $9,090
Net Result: $37,110
Tools: Microsoft Excel
Skills: Data Analysis, Accounting, Financial Reporting, Data Entry.
This project demonstrates my ability to organize financial records, analyze business performance, and create clear financial reports using Microsoft Excel.
Note: This is a portfolio demonstration using fictional financial data.

Great work 👏🏻

In September, I worked on an urgent project for an event. The task was to create visuals for an opening sequence showcasing the products of a newly rebranded company. Everything was created from scratch in a very short time and delivered on schedule. Most importantly, both the client and the audience were happy with the result.
The video shows a test run at the event venue.
Need a video for your event, exhibition, or presentation? Get in touch! My team and I are ready to help!


how tight was the deadline on this one

Most inbound bottlenecks aren't caused by low lead volume—they happen during triage.
When inquiries roll into a Google Sheet or CRM, operations teams often waste 10–15 minutes per submission reading through messy paragraphs, deciphering budget mismatch, and manually deciding who gets an immediate call vs. a standard rate sheet.
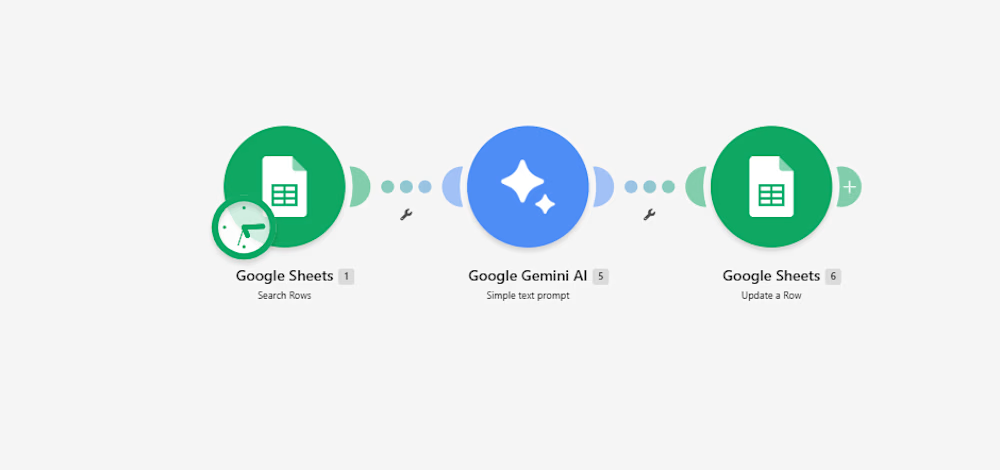
Instead of adding a bulky CRM add-on, I documented a lightweight 3-step automation pipeline built inside Make:
Intake & Extraction: An active listener triggers immediately upon a new submission, extracting core variables: client scope, target deliverables, timeline, and stated budget.
Context-Aware Evaluation (Gemini 2.5 Flash): The payload passes through an AI evaluation node with strict guardrails:
Evaluates budget against minimum agency criteria.
Assigns a triage score: Hot (immediate priority), Warm (nurture), or Cold (disqualified/template reply).
Generates a strict 15-word operational summary—no long paragraphs.
Determines an automated next step (e.g., routing to an account lead or flagging for asynchronous follow-up).
Data Return & Clean Pipeline: Appends the structured classification directly back to the master operational tracker, keeping the sheet filterable and clean.
The outcome: The sales and operations team can filter the entire board by priority status in two clicks, cutting first-touch response time to minutes without manually reading every single submission.
I’ve documented the full scenario map, execution logic, and data schemas below.
Curious how other agency operators and automation leads here handle their lead enrichment layer—are you doing AI scoring at the form level, or later in the CRM pipeline?:


For the budget gate, I'd keep an unstated budget separate from one explicitly below your minimum. Does the Make route ask for clarification when the amount or currency is missing, so a potentially suitable lead doesn't fall into Cold by default?