The network for creativity
Join 1.25M professional creatives like you
Connect with clients, get discovered, and run your business 100% commission-free
Creatives on Contra have earned over $150M and we are just getting started
Back to feedPost
The network for creativity
Join 1.25M professional creatives like you
Connect with clients, get discovered, and run your business 100% commission-free
Creatives on Contra have earned over $150M and we are just getting started
Related posts
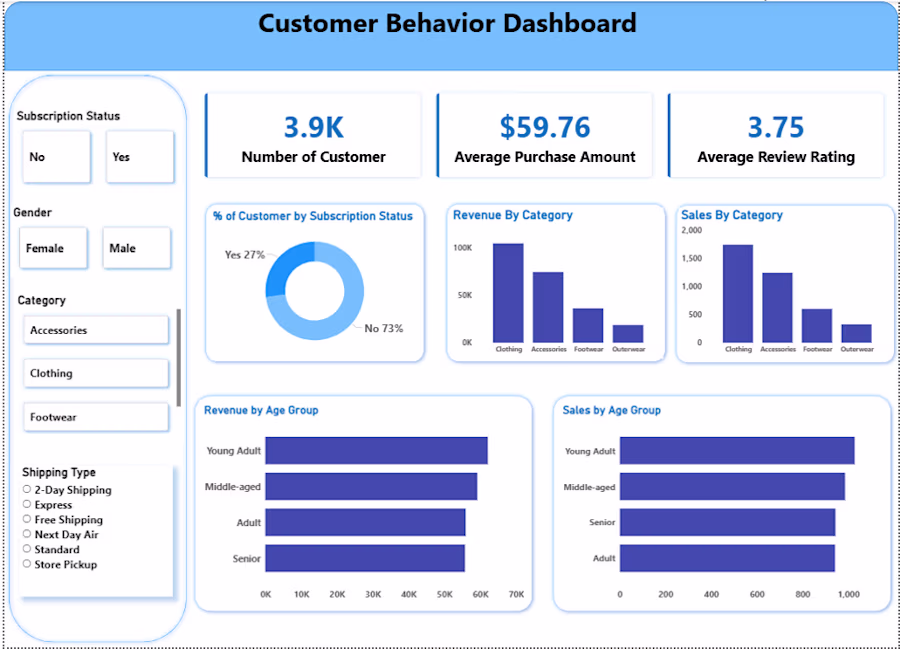
Built a Customer Behavior Dashboard analyzing 3.9K customers, tracking average purchase amount, review ratings, revenue by category, and sales by age group. Created using Power BI with interactive filters for gender, category, and shipping type. This project demonstrates end-to-end data analytics from raw data to business insights.
Kanza came to me knowing she had something. She's a founder, a web designer someone with a real point of view. But her videos weren't showing that. She was making edits that performed. The kind that bring in views, sure but the kind that attract everyone except the people she actually wanted to work with.
Her content felt disconnected from who she was. Not bad. Just not hers ♡ There's a difference.
How i helped Kanza get her spark back
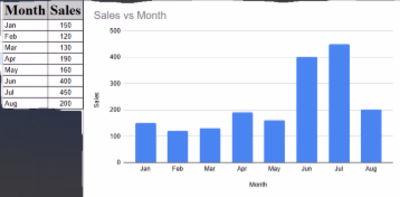
Drop & Explain — turn messy data into clear answers, instantly.
The problem: small business owners have data but no time and no money for an analyst, so their numbers go unused.
My solution: drop in a spreadsheet and instantly get clean charts plus a plain-language breakdown of what's happening and what to do next — and it all runs in your browser, so your data stays private.
Built entirely with Figma Make.
#configmakeathon @figma
Challenges
View allTrending
Claude
Claude has entered the design space. How are you using Claude Design?
Contra University
Learn from expert creatives how to earn more using next-gen AI tools.
MagicPath
The canvas is infinite, and exploration is becoming the workflow. How are you using MagicPath?
creativeaiflow
Creative AI workflows are evolving. What tools do you use, and what are their strengths and weaknesses?
freelancerlife
Freelancer life is wins, pivots, and everything in between. What’s yours right now?