The network for creativity
Join 1.25M professional creatives like you
Connect with clients, get discovered, and run your business 100% commission-free
Creatives on Contra have earned over $150M and we are just getting started
Back to feedPost

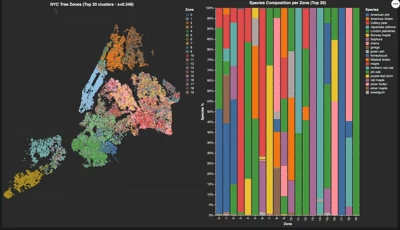
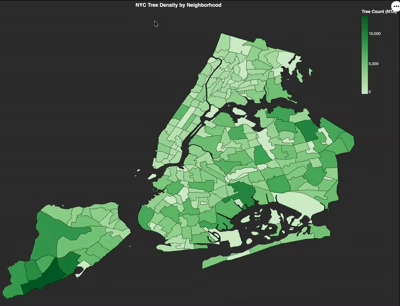
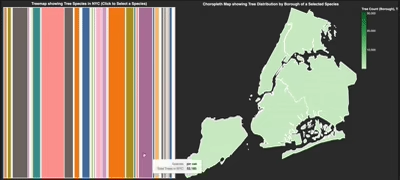
These are the interactive visualizations created based on NYC tree data. These three are interlinked with each other as you can see below. I used UMAp dimensionality reduction, showing spatial choropleth maps


The network for creativity
Join 1.25M professional creatives like you
Connect with clients, get discovered, and run your business 100% commission-free
Creatives on Contra have earned over $150M and we are just getting started





Related posts

I designed and engineered this interactive astronomical almanac for Ephemeris.
Blending nineteenth century celestial cartography with responsive data visualization required coordinating intricate astronomical calculations with period print typography. Programming a rotatable calendar dial that recalculates the night sky in real time, projecting accurate planetary alignments and lunar phases alongside a cataloged archive spanning 174 historical editions, turned complex ephemeris tables into an engaging visual experience.😊 👍


Another late night. Building a quant trading system an agentic model where different AI agents handle research, testing and risk, and none of them is allowed to place a trade on its own.
The hardest part so far? Being honest when the results say "not yet." Most strategies I've tested failed once real costs were included. That's exactly what testing is for.
Keeping The Psychology of Money and The Diary of a CEO close while I figure it out. What are you reading these days?


Curious how you’ve separated the agents from execution. When you say none can place a trade on its own, is that enforced through a separate execution service with fixed risk checks, human approval or both? I’d love to understand where the agent's decision-making ends and the hard rules take over.

I designed and developed a Spotify-inspired Music Analytics Dashboard in Microsoft Power BI, combining data modelling, DAX, interactive navigation, and custom dashboard design into a single analytical experience.
The dashboard allows users to explore music data from different perspectives — from overall performance and popularity to individual artists, songs, albums, and trends over time.
What I built
- Overview Dashboard — high-level KPIs and music performance trends
- Artist Analytics — artist rankings, song counts, popularity and catalogue analysis
- Song Analytics — song popularity, duration, year-wise analysis and album insights
- Interactive Navigation — seamless movement between dashboard sections
- Dynamic Visual Analysis — monthly trends, popularity patterns and category comparisons
- Detailed Data Tables — deeper exploration beyond summary-level KPIs
- Spotify-inspired UI — dark, modern interface designed around the visual identity of a music streaming platform
Key metrics explored
- 342 Artists
- 789 Distinct Songs
- 562 Albums
- Average Song Duration: 3.28 minutes
- Average Popularity: 90
Tools & Skills
Power BI · DAX · Data Modeling · Data Visualization · Interactive Dashboard Design · KPI Development · Business Intelligence
The goal wasn't simply to create another Power BI report — it was to make the data explorable, intuitive and visually engaging.
Interested in turning your own data into an interactive Power BI dashboard? Let's connect.
