The network for creativity
Join 1.25M professional creatives like you
Connect with clients, get discovered, and run your business 100% commission-free
Creatives on Contra have earned over $150M and we are just getting started
Back to feedPost

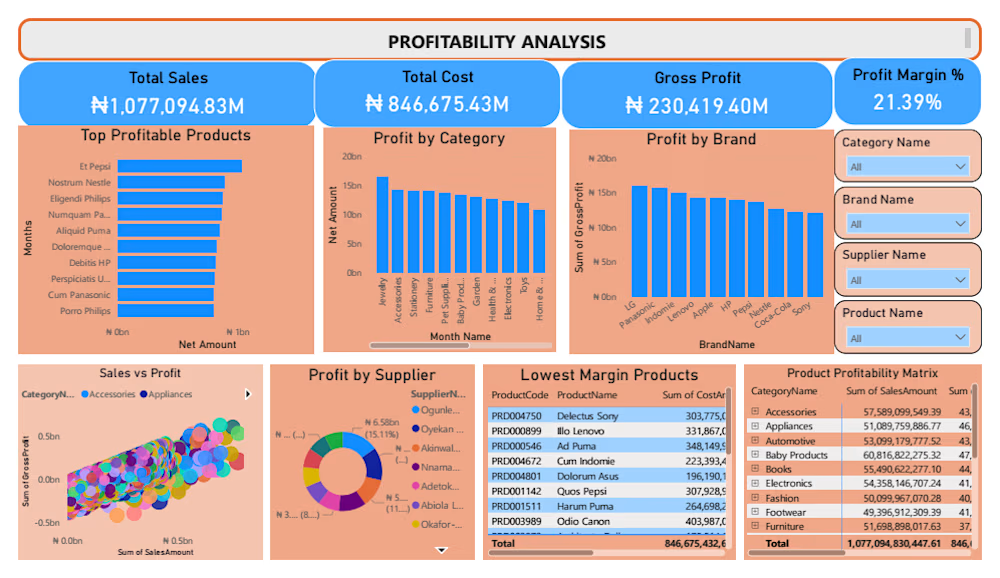
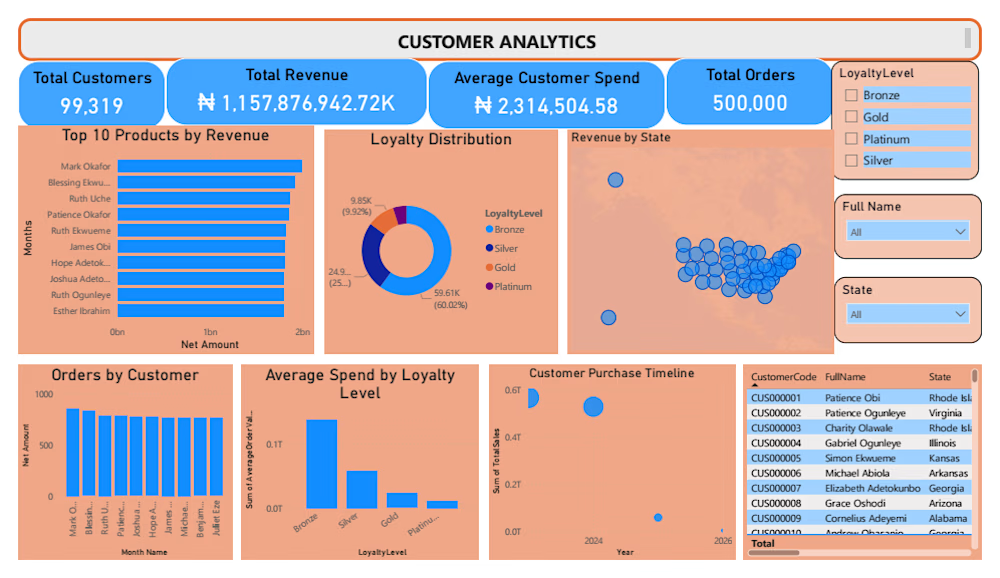
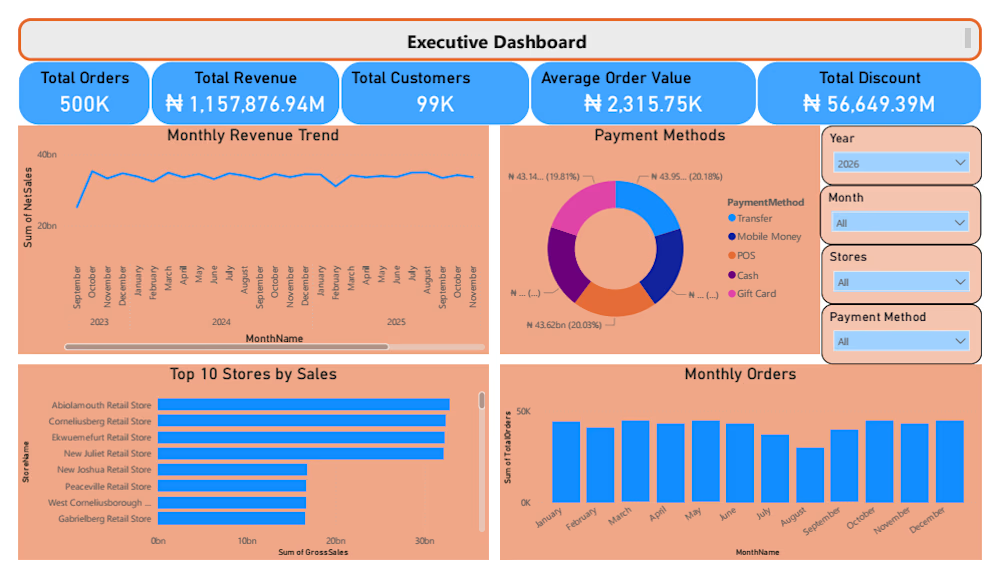
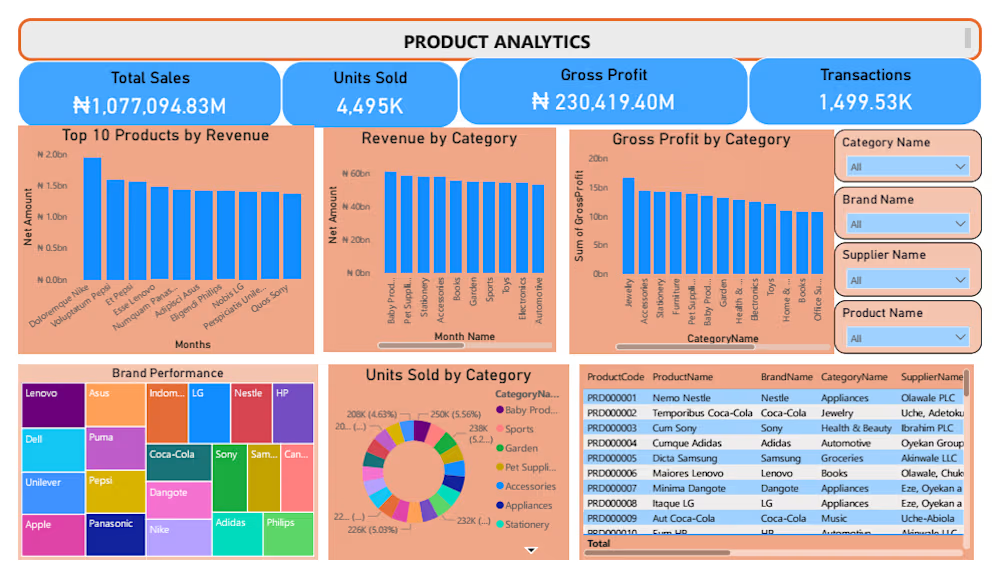
Enterprise retail analytics platform integrating sales, inventory, customers, products, employees, suppliers and store performance into a unified Power BI and SQL Server business intelligence environment.


The network for creativity
Join 1.25M professional creatives like you
Connect with clients, get discovered, and run your business 100% commission-free
Creatives on Contra have earned over $150M and we are just getting started





Related posts

What if your data looked like a beautifully printed science book?
For my first project here, I built something I dearly wanted for myself, a Genome Atlas: an editorial dashboard that reads the human genome like a book, chapter by chapter.
Three billion letters. Twenty thousand genes. Sixty-four codons that spell only twenty amino acids. I wanted to turn these numbers into something you feel before you read it: soft pastel watercolour, clean ink lines, and charts you can play with.
Ten chapters, ten ways to see data: chromosomes as gel lanes you can sort, a wheel of the genetic code that lights up every synonym, base pairs drawn like a chemistry textbook, and an animated flow that shows what you inherited from each grandparent.
Every figure comes with its source, because beautiful should never mean approximate.
It's now available for use here!


Turning 3 billion base pairs into a soft watercolour science book is seriously next-level craft, Sarah!
Quick nerd note from the startup legal side, since you're selling this as a digital product, adding a clear Single-User vs. Commercial License note (and a no-redistribution...

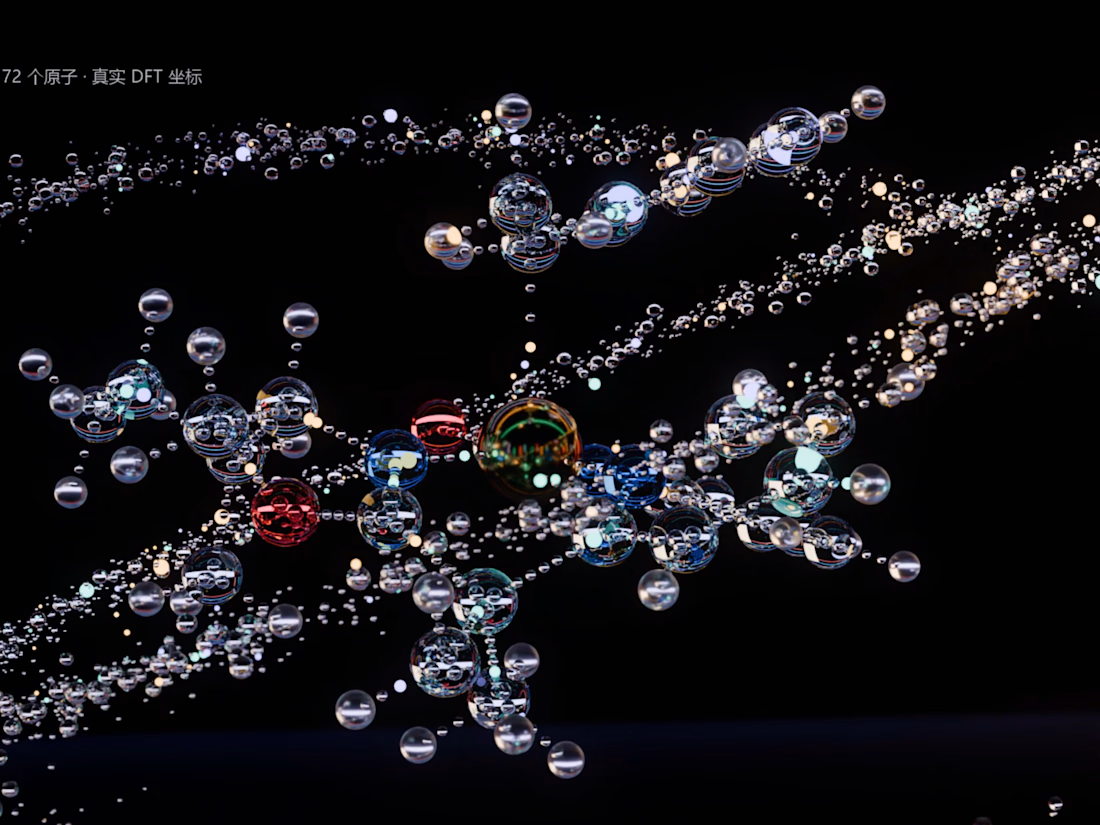
A 100% procedurally generated 3D animation rendered in Blender Cycles with zero manual modeling. Driven entirely by Python code, 4,883 refractive glass spheres


Signal — Brand Identity Design
An identity exploration for an AI voice-agent platform designed to simplify customer communication through intelligent call handling, appointment scheduling and automated responses.
The visual direction brings together a futuristic feel with subtle organic elements to create a distinctive identity.