The network for creativity
Join 1.25M professional creatives like you
Connect with clients, get discovered, and run your business 100% commission-free
Creatives on Contra have earned over $150M and we are just getting started
Back to feedPost

Sales Performance Dashboard
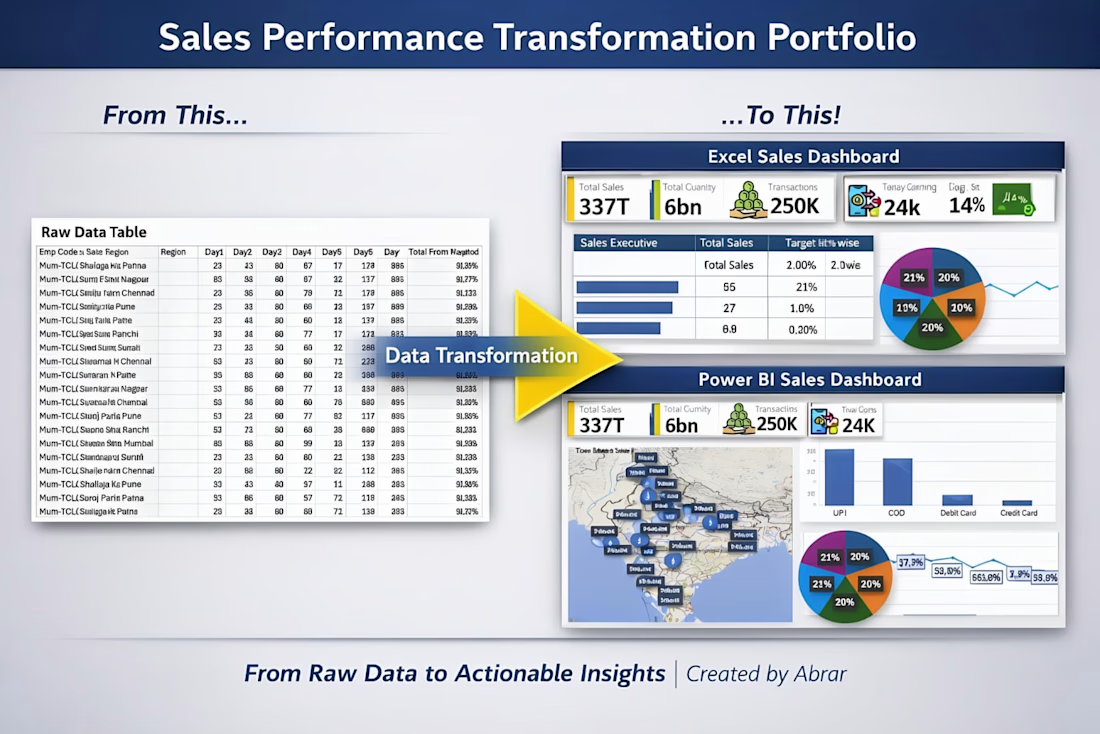
Transformed raw sales data into interactive Excel and Power BI dashboards. Cleaned and organized the dataset, created key performance indicators (KPIs), and designed visual reports to make sales performance, transactions, revenue, and regional trends easier to understand.


The network for creativity
Join 1.25M professional creatives like you
Connect with clients, get discovered, and run your business 100% commission-free
Creatives on Contra have earned over $150M and we are just getting started





Related posts

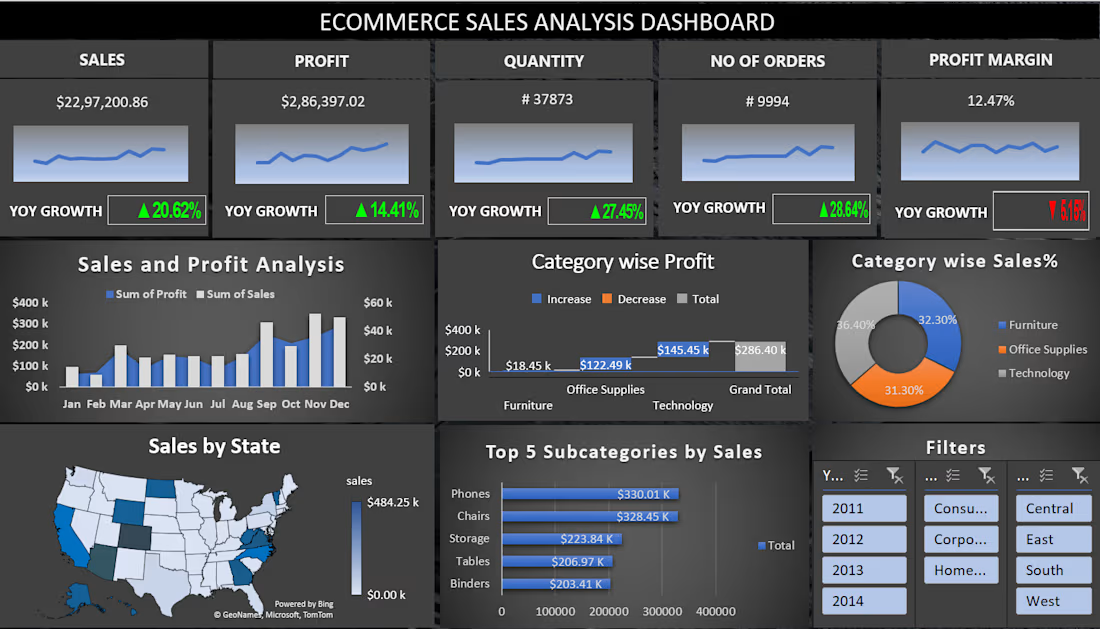
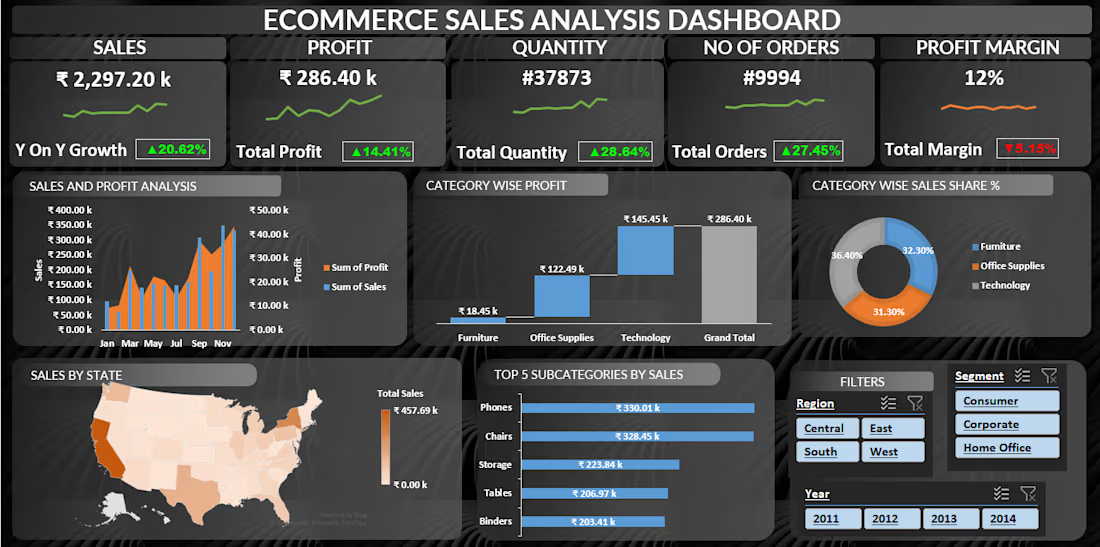
E-Commerce Sales Analysis Dashboard — Project Description
An interactive Power BI dashboard designed to analyze e-commerce sales performance and uncover business insights. The dashboard tracks key metrics such as sales, profit, quantity, orders, and profit margin, while providing detailed analysis by category, subcategory, region, state, segment, and year.
I used data cleaning, transformation, DAX measures, KPI cards, charts, maps, and interactive filters to create a user-friendly dashboard that helps identify sales trends, profitable categories, top-performing products, and regional performance.
Tools: Power BI, Power Query, DAX, Data Visualization

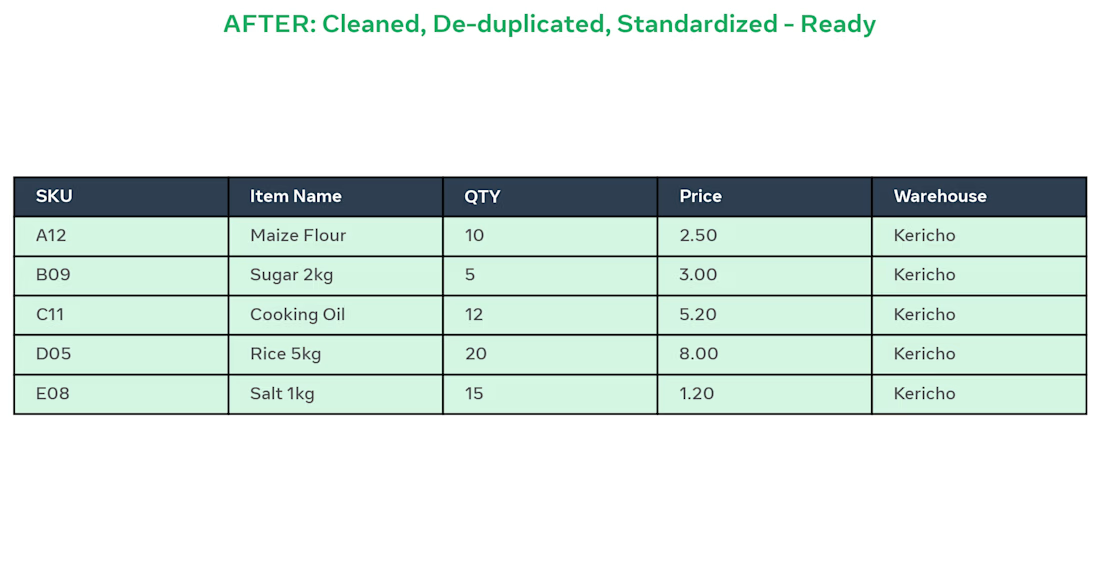
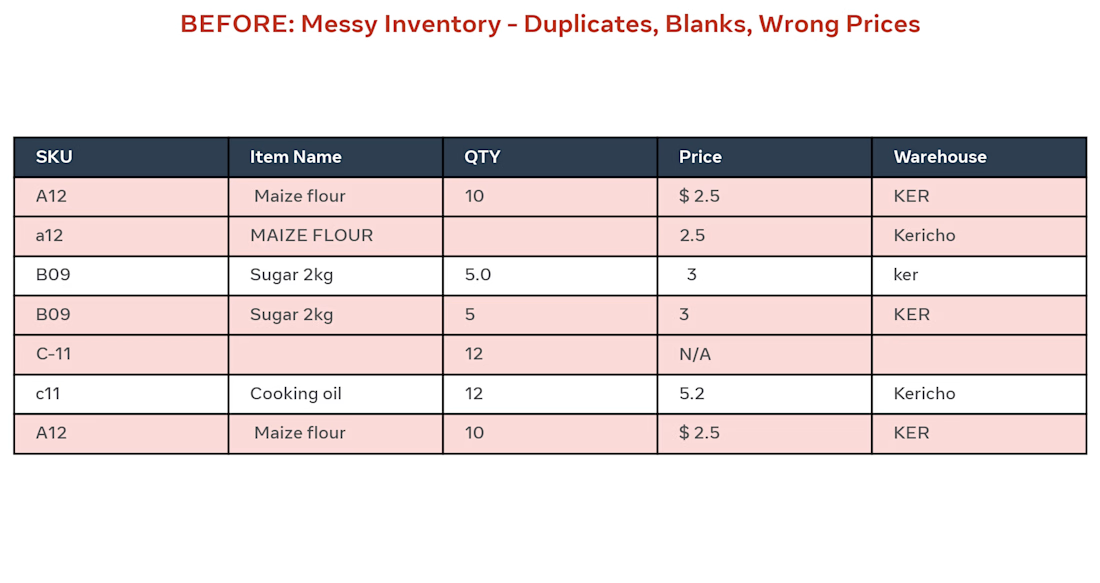
BEFORE: Client had messy Excel inventory with 500 rows, duplicates (A12 / a12), blanks, wrong prices like "$ 2.5" and "N/A", and different warehouse names (KER / ker / Kericho).
AFTER: I did:
Removed 12 duplicate SKUs
Standardized item names to Title Case
Fixed QTY and Prices to 2 decimals
Unified Warehouse to Kericho
Made sheet ready for pivot dashboard
Result: Clean, ready-to-use inventory in 2 days using Excel.
Tools: Excel, Remove Duplicates, Text to Columns, TRIM, PROPER

E-Commerce Sales Analysis Dashboard — Excel