The network for creativity
Join 1.25M professional creatives like you
Connect with clients, get discovered, and run your business 100% commission-free
Creatives on Contra have earned over $150M and we are just getting started
Back to feedPost

Empowering career growth through a streamlined SaaS UI/UX that organizes applications and schedules in one powerful view. Introducing, Joobin.
#UIUX #WebDesign #DashboardDesign #SaaS #JobSeeker


The network for creativity
Join 1.25M professional creatives like you
Connect with clients, get discovered, and run your business 100% commission-free
Creatives on Contra have earned over $150M and we are just getting started
Related posts

Your SaaS product might be solving the wrong problem. And most designers don't realize it.
Before jumping into Figma, designing dashboards, or creating beautiful interfaces, there's something much more important to understand.
The difference between a Business Problem and a User Problem.
In Part 01 of my SaaS Product Design Masterclass, I'm breaking down:
🔹 1.1 — Start with the Business Problem
🔹 1.2 — Understand the Business Impact
🔹 1.3 — Identify the User Problem
🔹 1.4 — How Business Problems and User Problems are connected, but different.
Here's an important thought:
A business wants to achieve a goal.
A user wants to solve a problem.
Great digital products understand both.
This is where meaningful product differentiation begins — not with UI, but with problem understanding.
🎯 This is Part 01 of my 10-hour practical SaaS Product Design series, where I'll walk through the complete process of understanding and designing a SaaS product.
If you're a UX/UI Designer, Product Designer, aspiring designer, or SaaS founder, this series is for you.
One question: Do you start your design process with business problems or user problems?
Share your thoughts below!
#SaaSProductDesign #UXDesign #ProductDesign #UXResearch #DigitalProduct


Useful way to explain it.

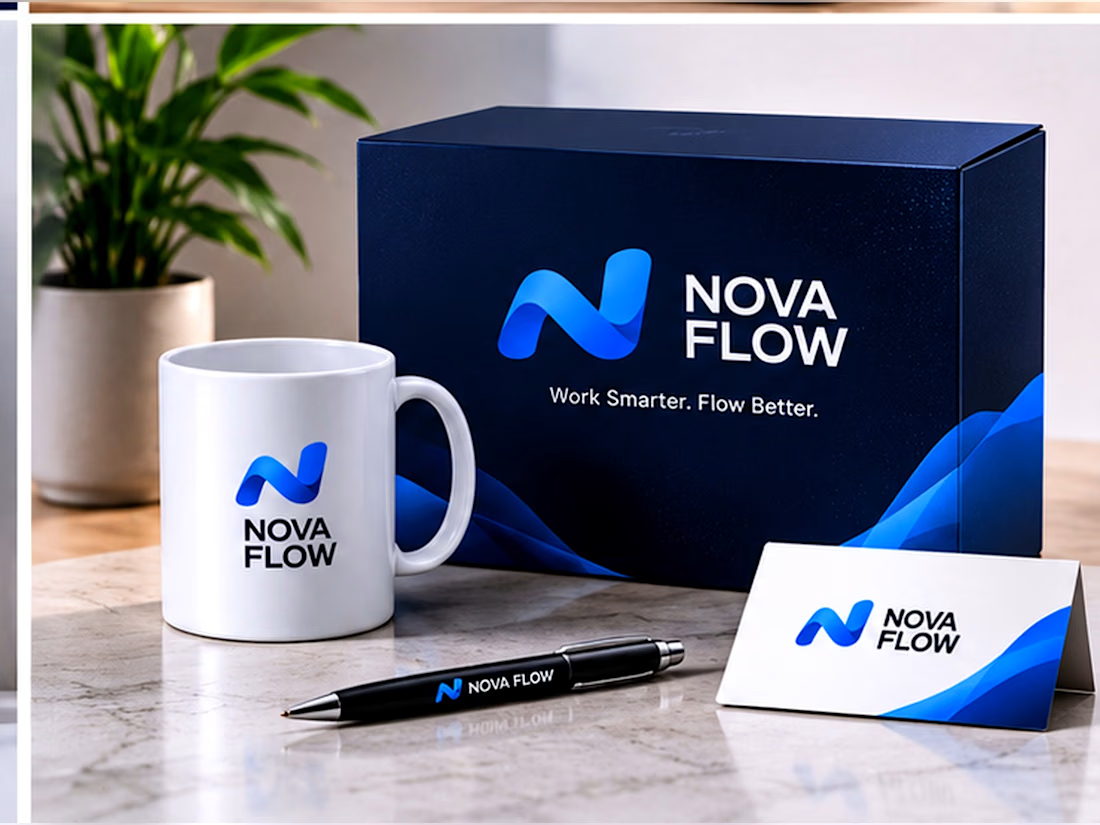
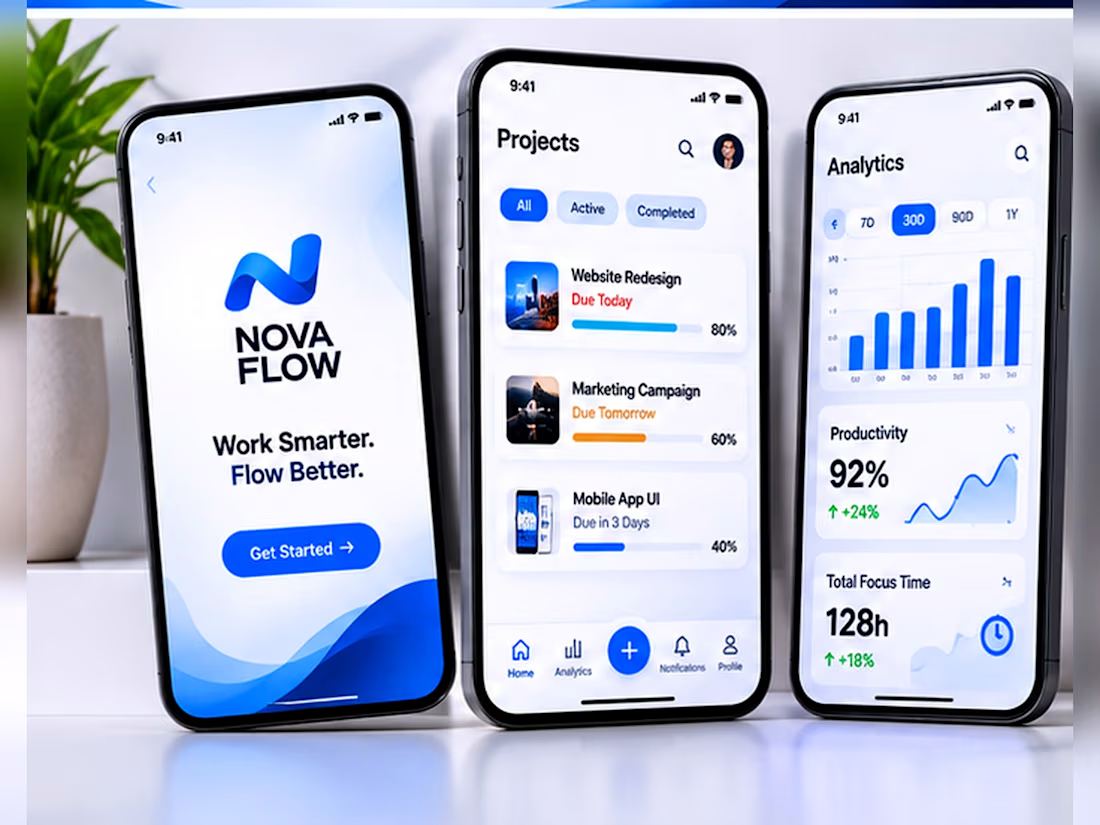
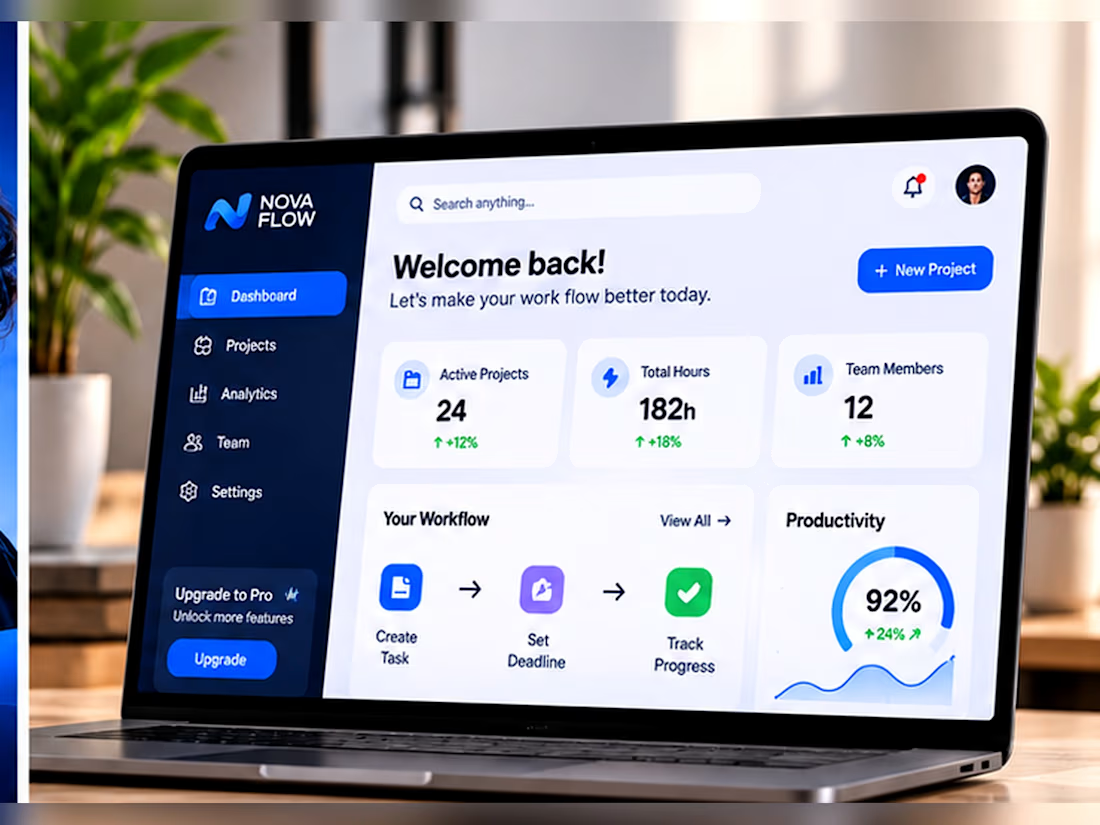
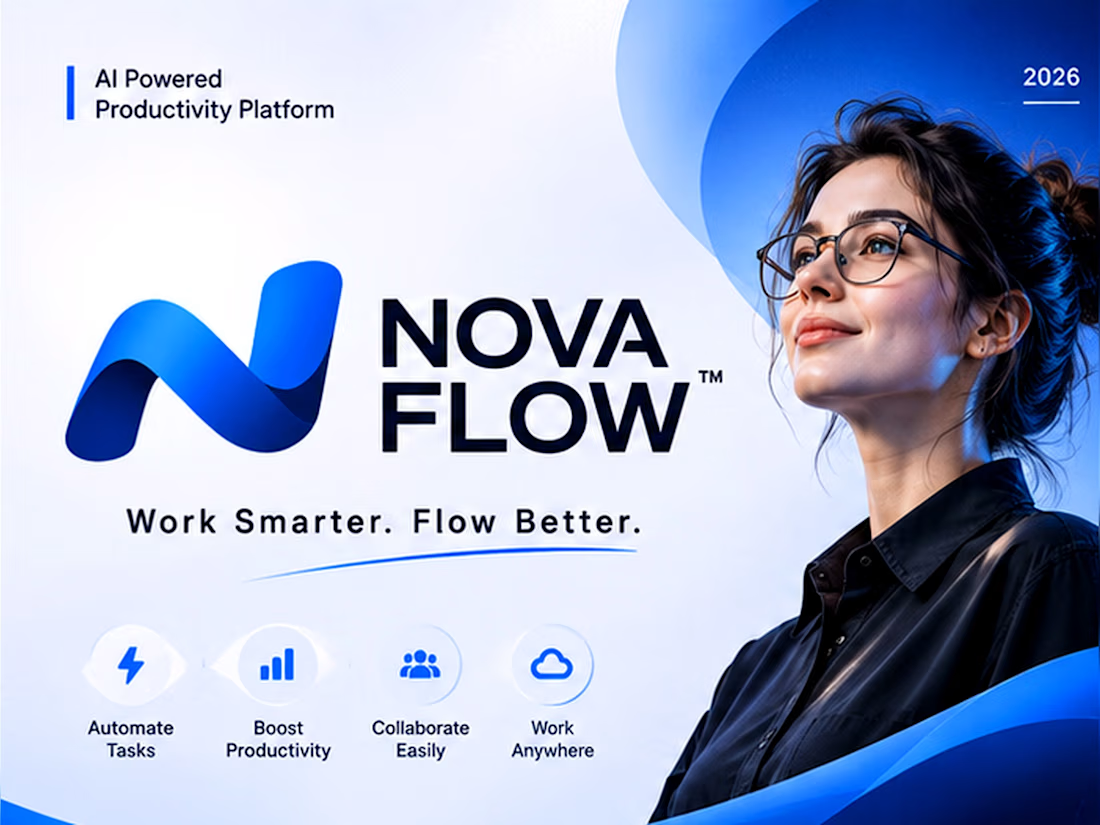
AI SaaS Brand Identity + Website UI/UX Design.
Project title: NOVA FLOW – AI SaaS Branding & Website UI/UX Design
Project description:
Designed a complete visual identity and digital experience for NOVA FLOW, a fictional AI-powered productivity platform. The project includes brand identity, dashboard UI, responsive website design and social media creatives.
Skills to add:
Brand Identity Design
Graphic Design
UI/UX Design
SaaS Website Design
Social Media Design
Figma



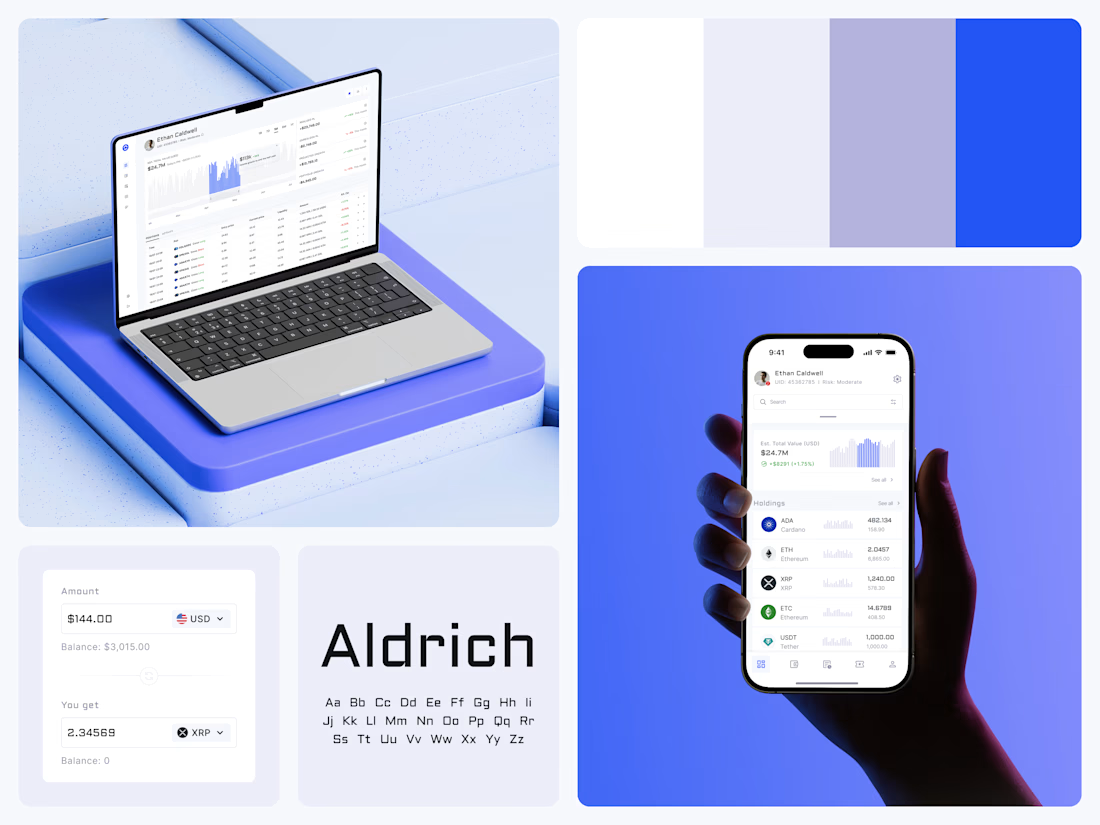
Crypto Portfolio Dashboard
Blue means one thing here: the range you are looking at.
The value chart is a row of thin gray bars, and only the selected date range fills in blue. You read the period that matters and keep the months around it as context.
The phone carries the same chart above the holdings list. Each coin gets its own small bar chart between the name and the amount, so you can scan the whole portfolio for movement without opening a single coin.
Trading screens get busy fast. This one stays light and calm, so the numbers lead: total value, realized and unrealized P&L and open positions, all on one screen.
Designed by the Hue & Machine team.
#Crypto #Fintech #DashboardDesign #TradingPlatform #DataVisualization #UIDesign #ProductDesign #WebApp #MobileDesign #FigmaDesign



Nice Ui Dmytro