The network for creativity
Join 1.25M professional creatives like you
Connect with clients, get discovered, and run your business 100% commission-free
Creatives on Contra have earned over $150M and we are just getting started
Back to feedPost

Overview
I built an interactive Power BI dashboard to analyze employee attrition and identify workforce patterns that may require attention from HR and management teams.
Business Problem
HR teams need a clear view of employee turnover, but raw employee data can make it difficult to identify where attrition is concentrated and which workforce characteristics are associated with higher turnover.
Approach
I transformed a synthetic HR dataset into a structured Power BI report using calculated measures, interactive filters, and business-focused visualizations.
The report contains two pages:
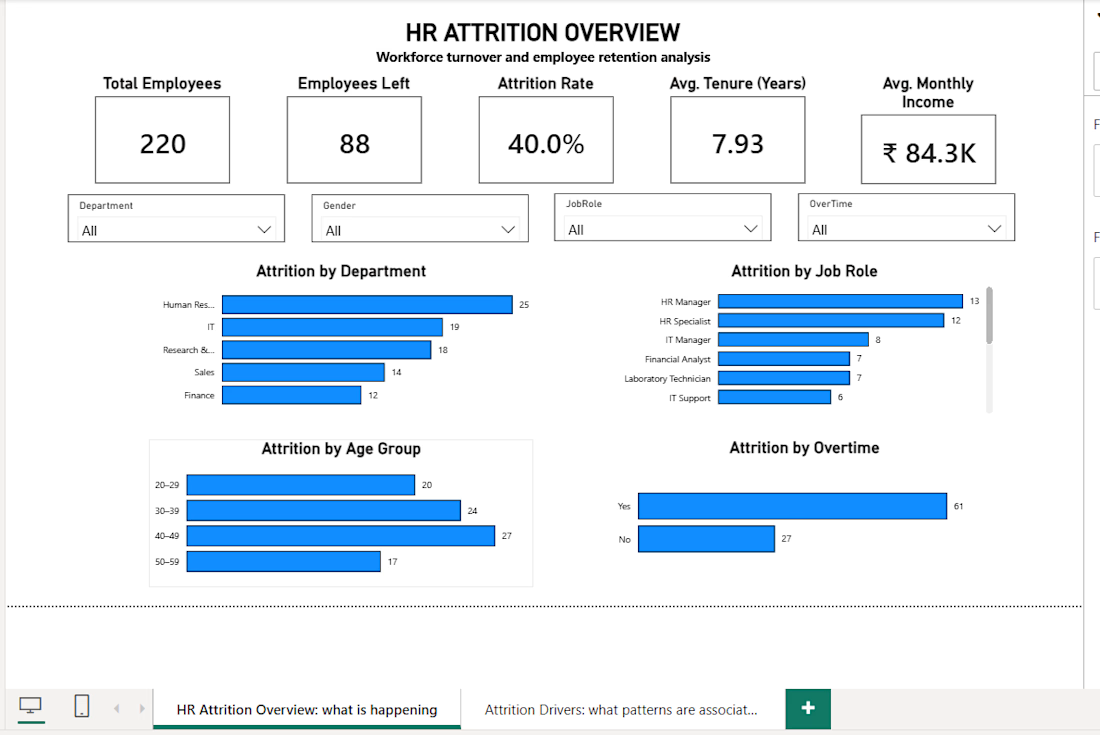
HR Attrition Overview
Total employees
Employees left
Attrition rate
Average tenure
Average monthly income
Attrition by department, job role, age group, and overtime
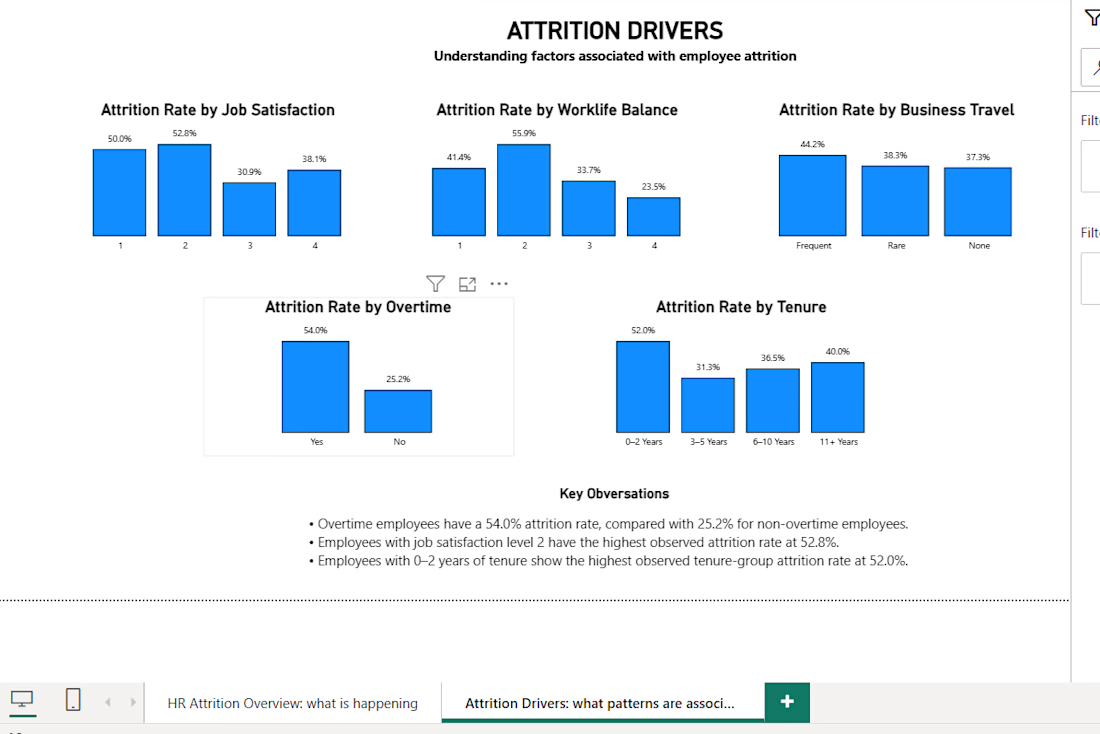
Attrition Drivers
Attrition rate by job satisfaction
Work-life balance
Overtime
Business travel
Tenure
Key Insights
The analysis showed notable differences in attrition across overtime status, job satisfaction levels, and tenure groups. These patterns can help HR teams identify areas for deeper retention analysis.
Tools & Skills
Power BI • DAX • Data Analysis • Data Visualization • Dashboard Design • KPI Reporting • Business Intelligence • Workforce Analytics
Project Type: Self-initiated analytics project using synthetic HR data.


The network for creativity
Join 1.25M professional creatives like you
Connect with clients, get discovered, and run your business 100% commission-free
Creatives on Contra have earned over $150M and we are just getting started
Trending
retrofuturism
Share your favorite designs from the past exploring the distant future. Or your own take on the aesthetic 🚀
halftone
Dots. Texture. Grain. Let's see your designs using the halftone technique.

Midjourney
Creatives are showing off what they're making with Midjourney.
colorgrade
Video editors sound off: How do you enhance the mood of your video in color grading?
Related posts

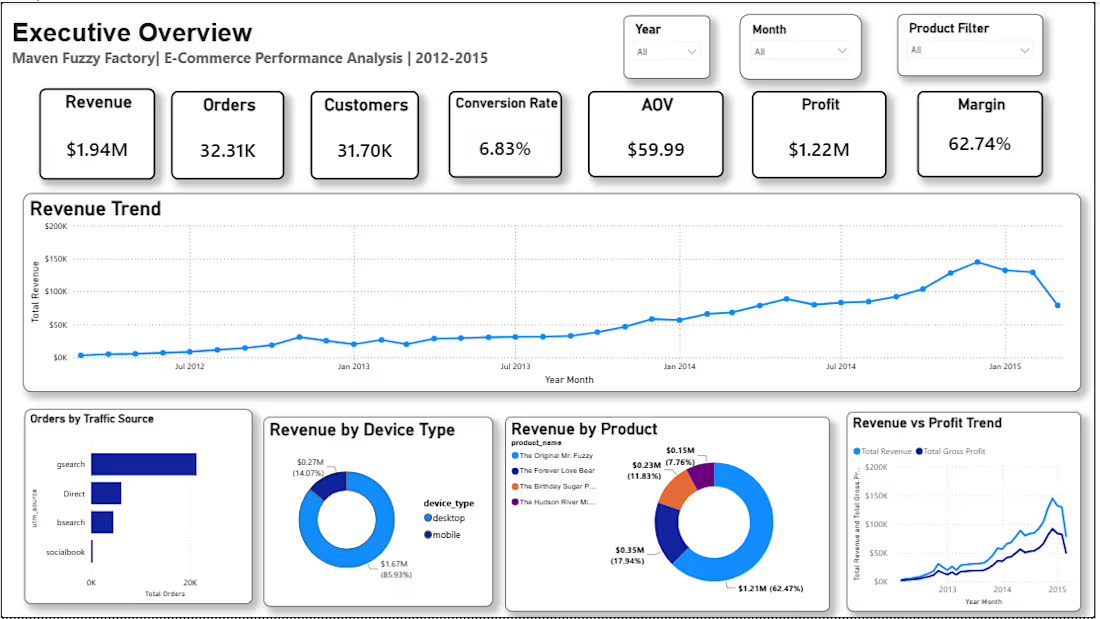
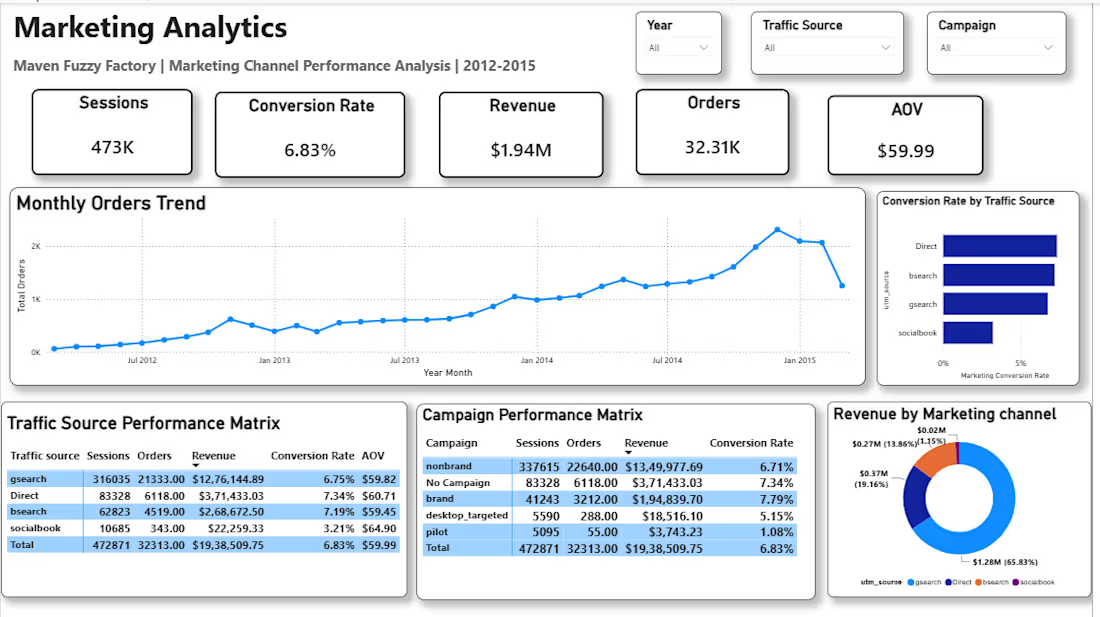
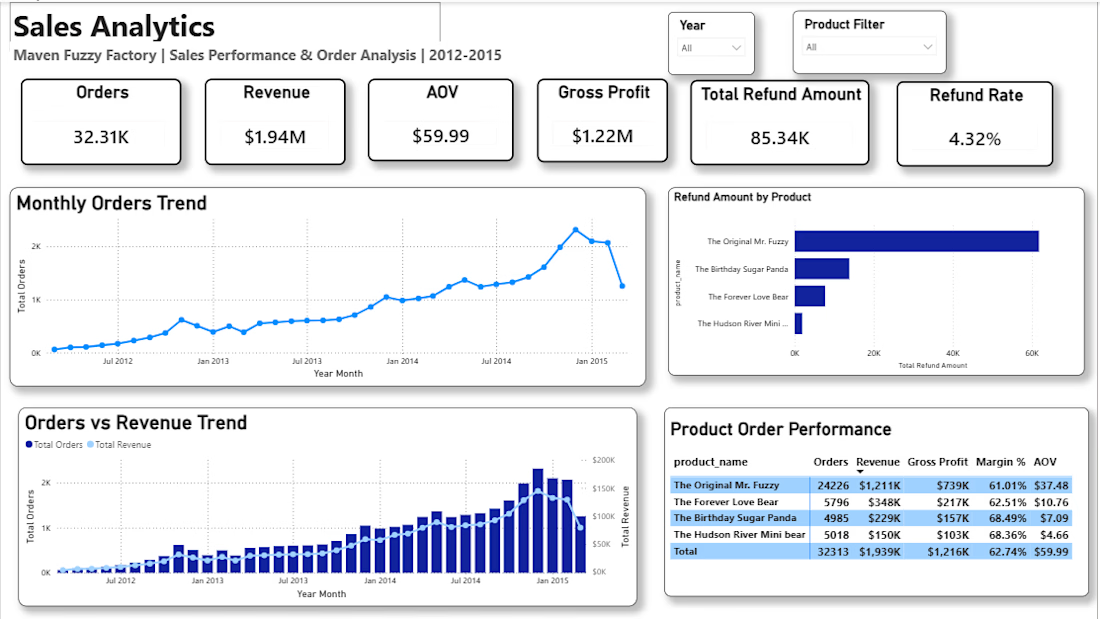
Built an end-to-end e-commerce BI solution using SQL and Power BI. Cleaned and modeled website session, pageview, order and refund data, developed business KPIs and interactive dashboards to analyze sales, customer behavior, conversion, and marketing performance.


great work💯

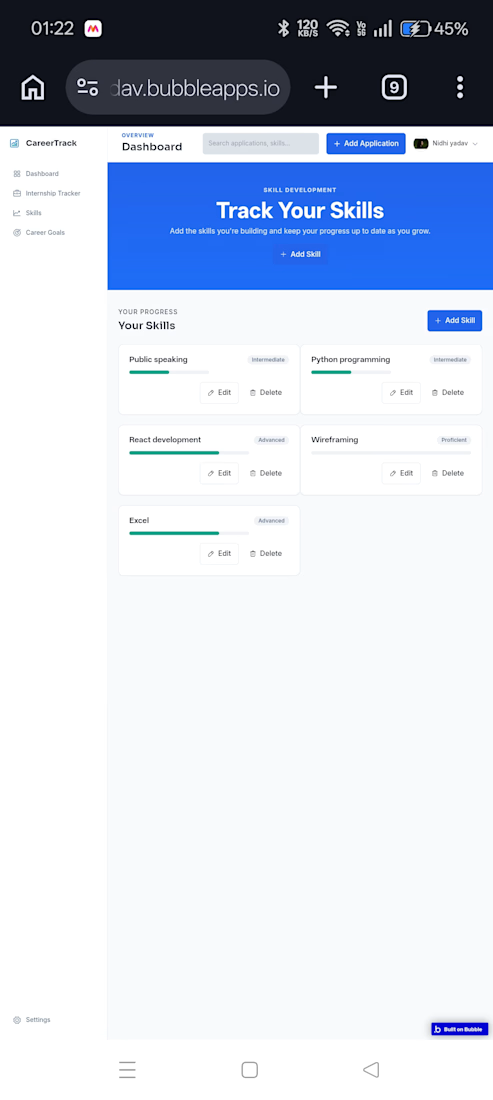
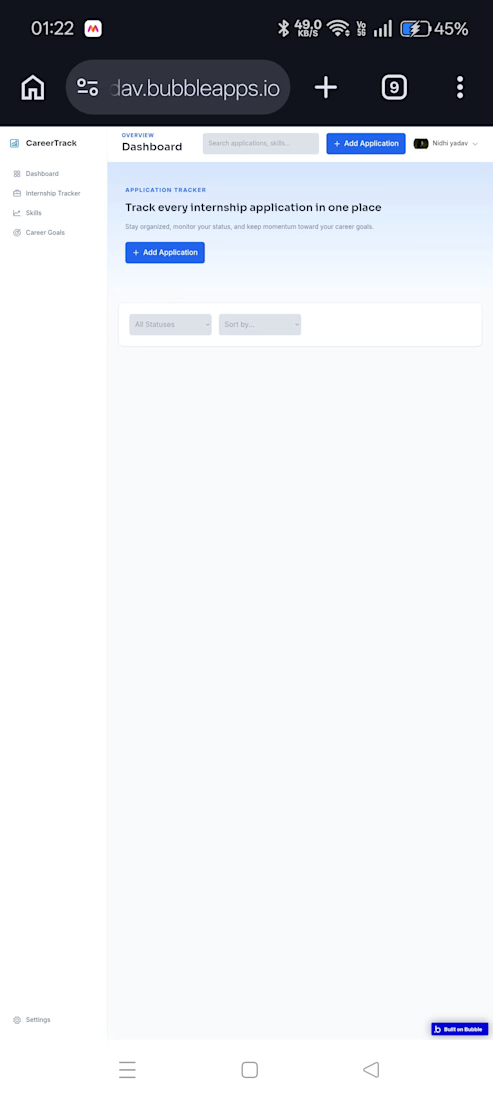
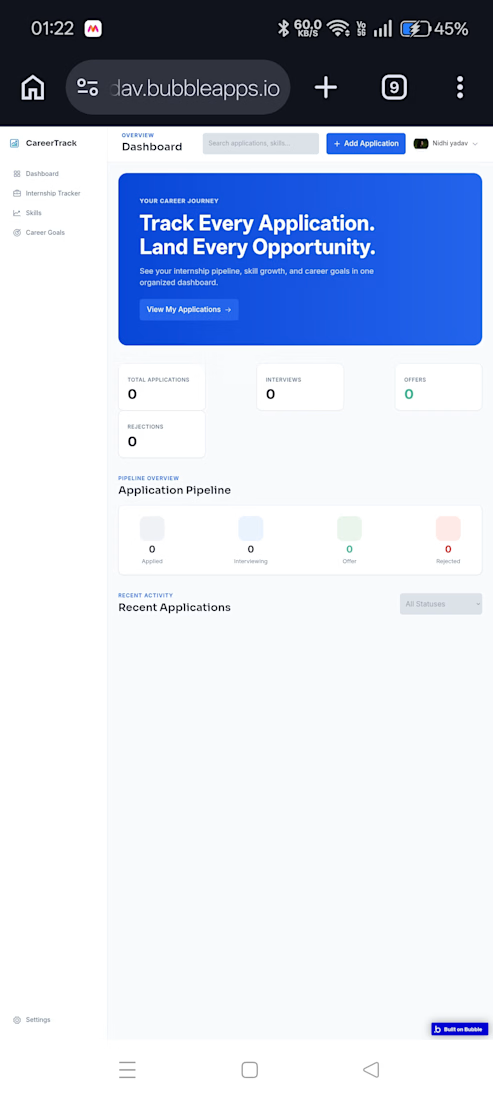
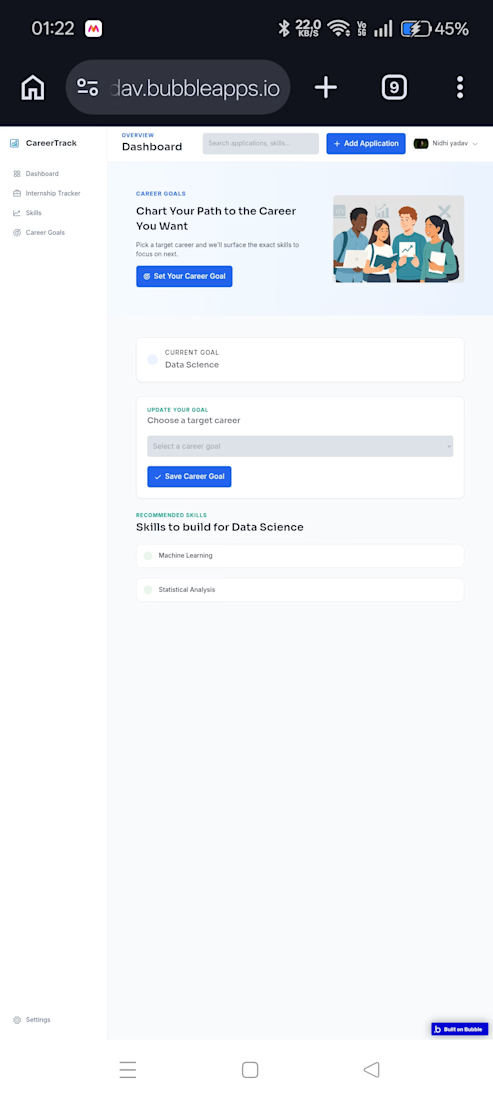
I built CareerTrack, an internship and career management dashboard that helps users track internship applications, monitor application status, manage their skills and progress, and set career goals. The goal was to create a simple, organized dashboard that keeps the entire career journey in one place.