The network for creativity
Join 1.25M professional creatives like you
Connect with clients, get discovered, and run your business 100% commission-free
Creatives on Contra have earned over $150M and we are just getting started
Back to feedPost
Hello there!
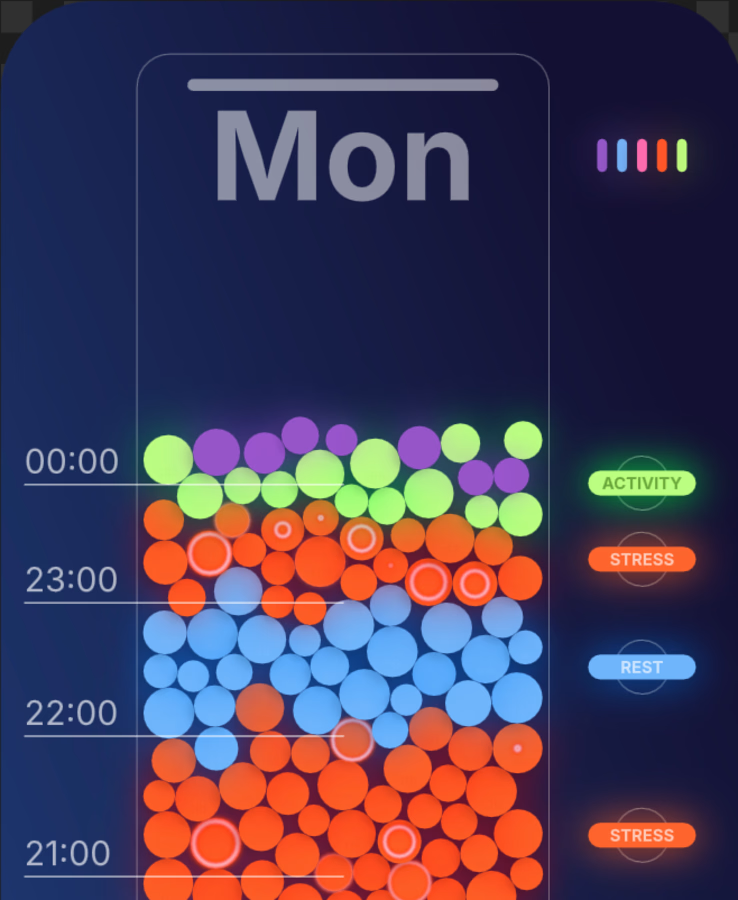
I made a working prototype for a new concept while exploring health app data visualisation. I wanted to show boring stats in a more interesting way than standard line or bar charts, and the new Rive scripting features felt perfect for testing this idea in a real prototype.
The goal is to make daily heart rate measurements interactive and easy to read at the first look, so users can better understand how their body behaves.
There are five heart rate groups and stress is the most important one, as it happens when heart rate is high without movement and is harmful in the long term. With a quick look at the visualisation, you can see how much stress you had, how long it lasted, and when it happened.
This prototype shows good potential, and with Rive it is possible to make health data interactive and fun to use.
Thanks
If someone wants to play with it:
https://rive.app/s/eDQm8aaNeEq_597mYF7zmg/?runtime=rive-renderer
This is so good for anyone that processes information visually (aka most of us)
The network for creativity
Join 1.25M professional creatives like you
Connect with clients, get discovered, and run your business 100% commission-free
Creatives on Contra have earned over $150M and we are just getting started
Related posts
The status tags and filters look genuinely fast to scan, that contracts table could easily feel overwhelming but it doesn't. How much of the motion is functional feedback versus just polish for the demo reel?
I love when clients have proper brand guidelines to follow, so I can translate their identity into a living motion system properly.
This was a really fun project to work on, especially finding a way to incorporate the branded dot and making it have its own personality through motion. 😊
Great execution and attention to detail. Love it Dani!
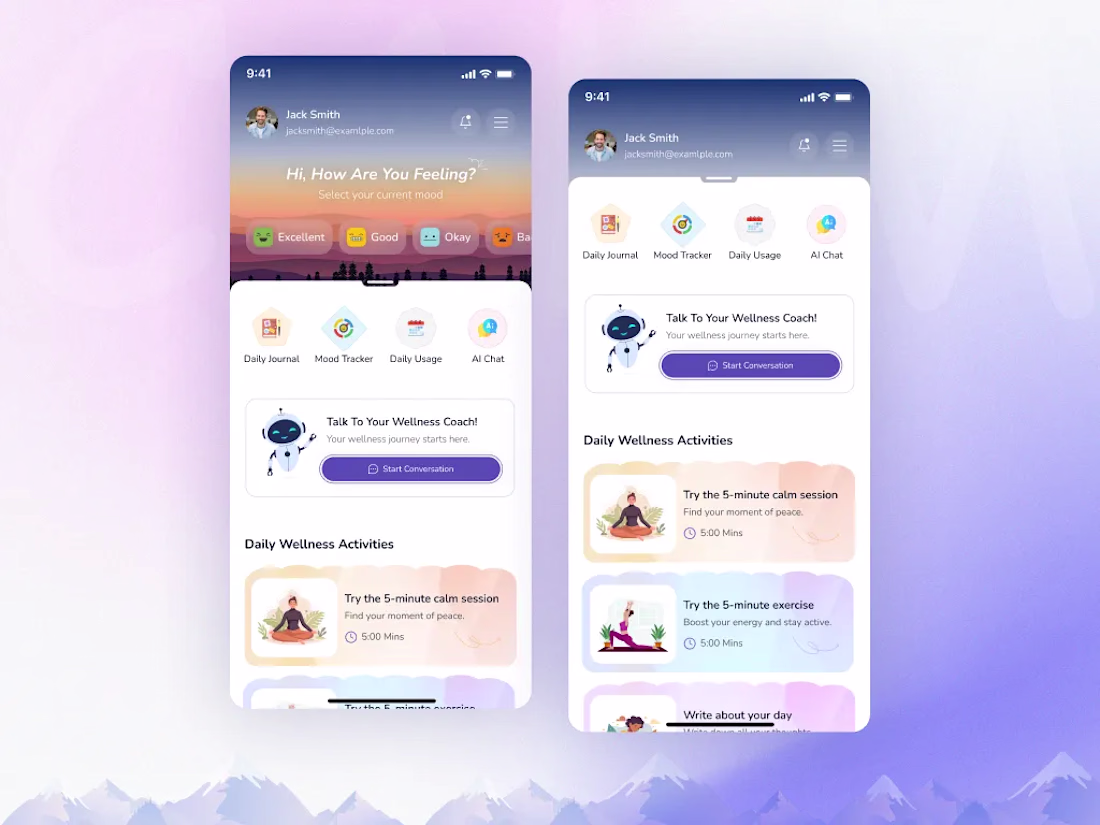
What do you think of this layout and the color palette for wellness application?
The app allows user to keep track of their mood and suggest activities based on their mood. User can talk to AI assistant coach and get help to calm themself down. I'd love to hear your feedback on the visual hierarchy, the card components, or any ideas you have to improve the overall user experience!
Trending
Claude
Claude has entered the design space. How are you using Claude Design?
Contra University
Learn from expert creatives how to earn more using next-gen AI tools.
creativeaiflow
Creative AI workflows are evolving. What tools do you use, and what are their strengths and weaknesses?
freelancerlife
Freelancer life is wins, pivots, and everything in between. What’s yours right now?
