The network for creativity
Join 1.25M professional creatives like you
Connect with clients, get discovered, and run your business 100% commission-free
Creatives on Contra have earned over $150M and we are just getting started
Back to feedPost

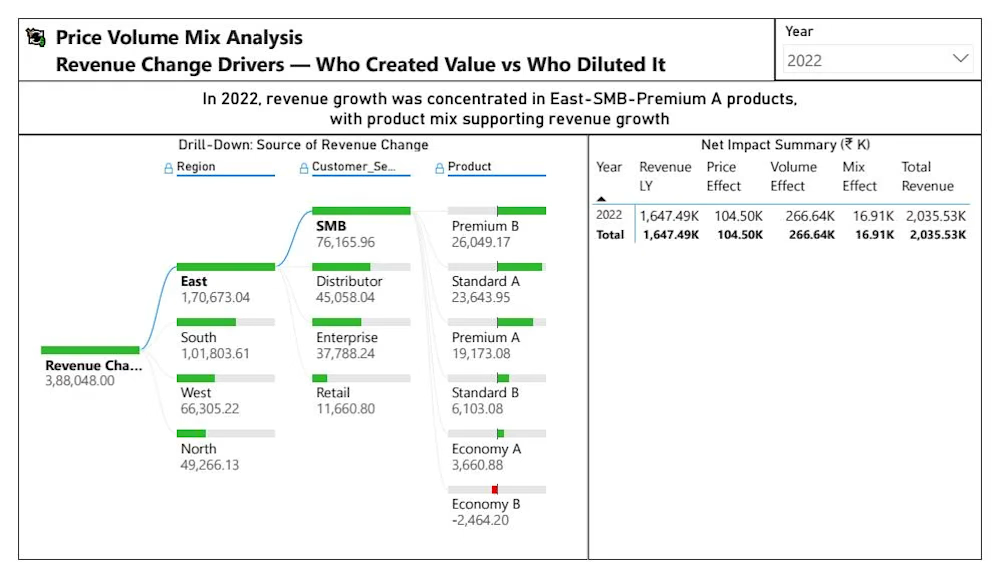
Enterprise Price Volume Mix Analytics


The network for creativity
Join 1.25M professional creatives like you
Connect with clients, get discovered, and run your business 100% commission-free
Creatives on Contra have earned over $150M and we are just getting started
Related posts

Revenue Variance Analysis | Price, Volume & Mix (PVM)
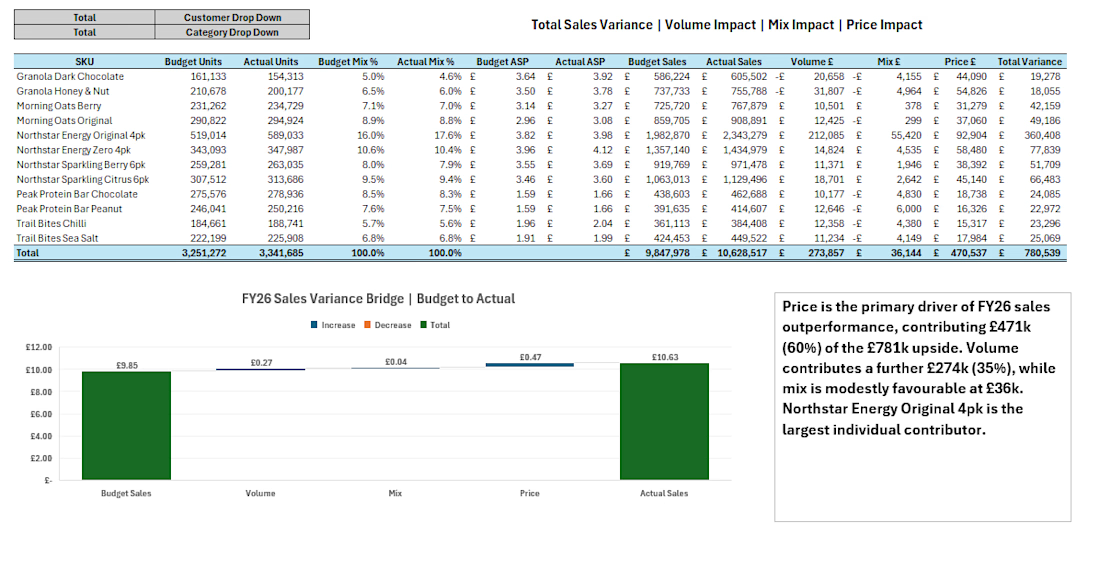
Developed an Excel-based revenue variance analysis model for a fictional FMCG business to identify the underlying drivers of budget versus actual sales performance.
The analysis separates revenue movements into price, volume and product mix impacts, providing greater visibility into commercial performance.
Key features:
Price, Volume & Mix variance calculations
Budget versus actual revenue reconciliation
Interactive customer and category analysis
Variance bridge visualisation
Identification of key revenue performance drivers
Business value: Helps commercial and finance teams understand why revenue changes, identify pricing and volume opportunities, and support more informed business decisions.
Independent portfolio demonstration using fictional data. Part of the Northstar Consumer Products financial analysis project.


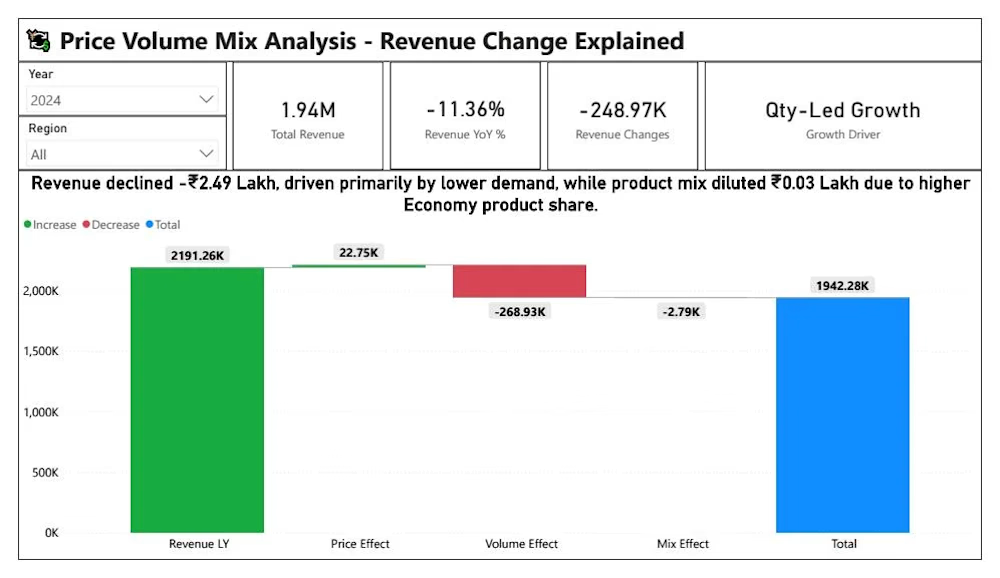
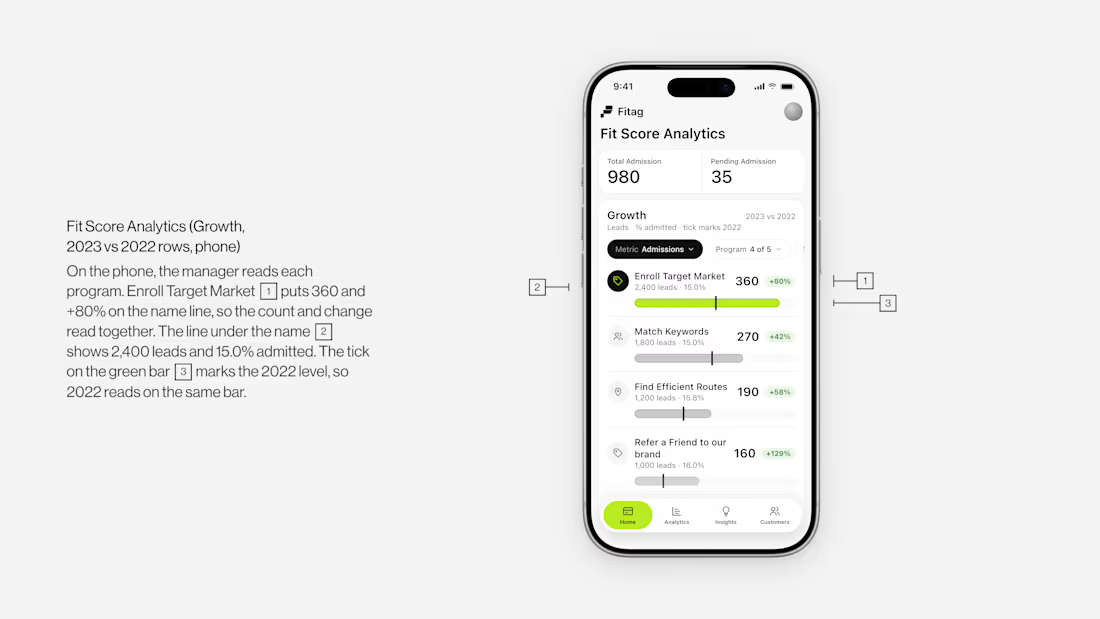
Year over year growth filtering for e-comm B2B platform
Customer & SKU Profitability Analysis | Excel FP&A
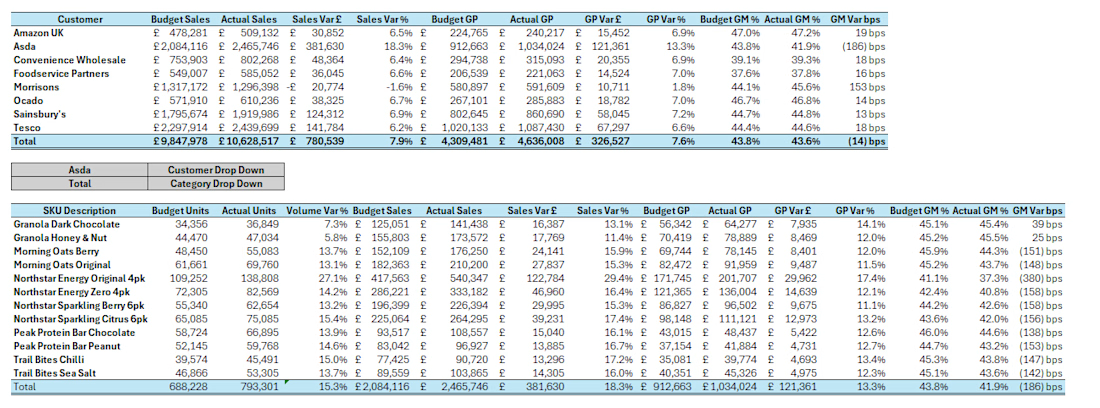
Developed an Excel-based profitability analysis tool for a fictional FMCG business, providing detailed financial insights across customers, product categories and individual SKUs.
The model combines budget versus actual reporting with interactive filtering to help identify profitability drivers and areas requiring commercial attention.
Key features:
Customer, category and SKU-level financial analysis
Revenue, gross profit and gross margin reporting
Budget versus actual performance comparisons
Gross margin variance analysis in basis points
Dynamic customer and category filters
Business value: Enables finance and commercial teams to identify underperforming products, understand customer profitability and make more informed pricing and portfolio decisions.
Independent portfolio demonstration using fictional data. Part of the Northstar Consumer Products financial analysis project.