The network for creativity
Join 1.25M professional creatives like you
Connect with clients, get discovered, and run your business 100% commission-free
Creatives on Contra have earned over $150M and we are just getting started
Back to feedPost

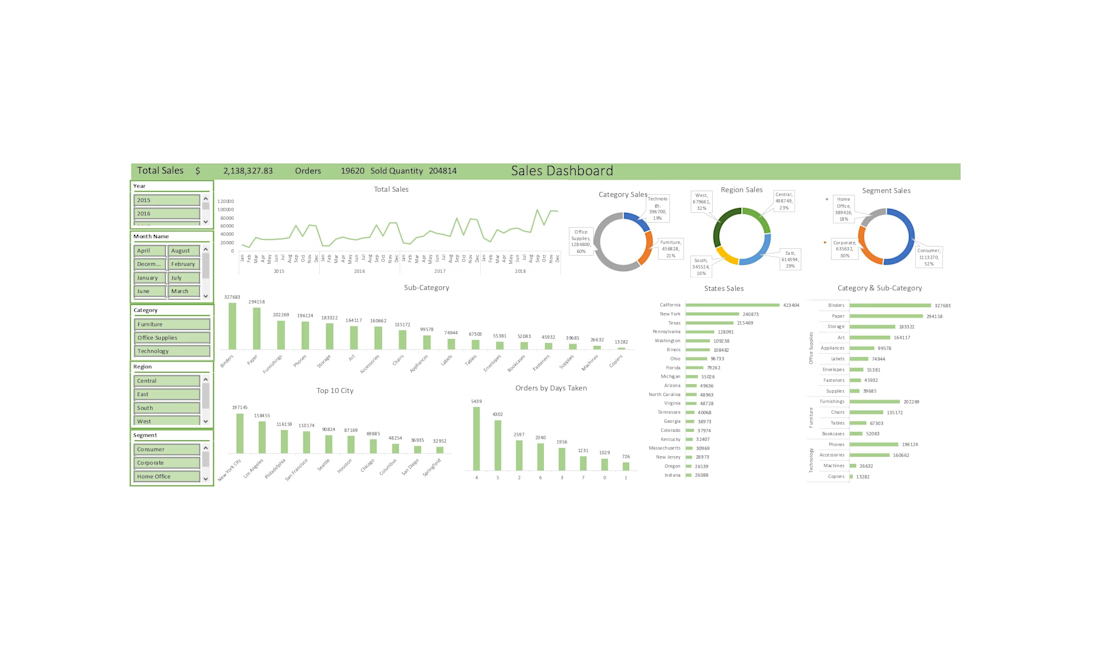
-- Business Problem
Analyze retail sales data to identify sales trends, profitable products, customer behavior, and regional performance to improve business decisions and maximize profit.
-- What I Did
* Cleaned and organized the data.
* Created calculated fields (Revenue, Cost, Profit).
* Built Pivot Tables and Pivot Charts.
* Designed an interactive Excel dashboard with slicers.
* Analyzed sales, profit, products, customers, and regional performance.
* Created KPI cards for key business metrics.
-- Key Insights
* Total Revenue: 14.30M generated from 5,000 transactions.
* Fashion generated the highest profit (1.66M) among all product categories.
* Electronics recorded the highest sales revenue (6.32M).
* Groceries contributed the lowest revenue and profit, indicating lower business performance.
* The business has a balanced revenue distribution between Fashion and Electronics, while Groceries have growth potential.
* Profitability varies across categories, highlighting opportunities to optimize pricing and promotional strategies.
-- Recommendations
* Increase focus on high-profit products.
* Improve sales in low-performing regions.
* Optimize discounts to maximize profit.
* Plan inventory based on monthly sales trends.
* Launch targeted marketing campaigns for customer retention.

The network for creativity
Join 1.25M professional creatives like you
Connect with clients, get discovered, and run your business 100% commission-free
Creatives on Contra have earned over $150M and we are just getting started
Trending

Claude
Claude has entered the design space. How are you using it?

Contra University
Learn from expert creatives how to earn more using next-gen AI tools.
Brand Design
The best brand designers are on Contra. Scroll to see what's trending in brand design. What are you building?
creativeaiflow
Creative AI workflows are evolving. What tools do you use, and what are their strengths and weaknesses?
freelancerlife
Freelancer life is wins, pivots, and everything in between. What’s yours right now?



Related posts

Good software isn't just about beautiful interfaces, it's about helping businesses make smarter decisions. I enjoy building dashboards that transform complex data into simple, actionable insights while maintaining speed, scalability, and an intuitive user experience. Every detail is designed to improve productivity and support business growth.


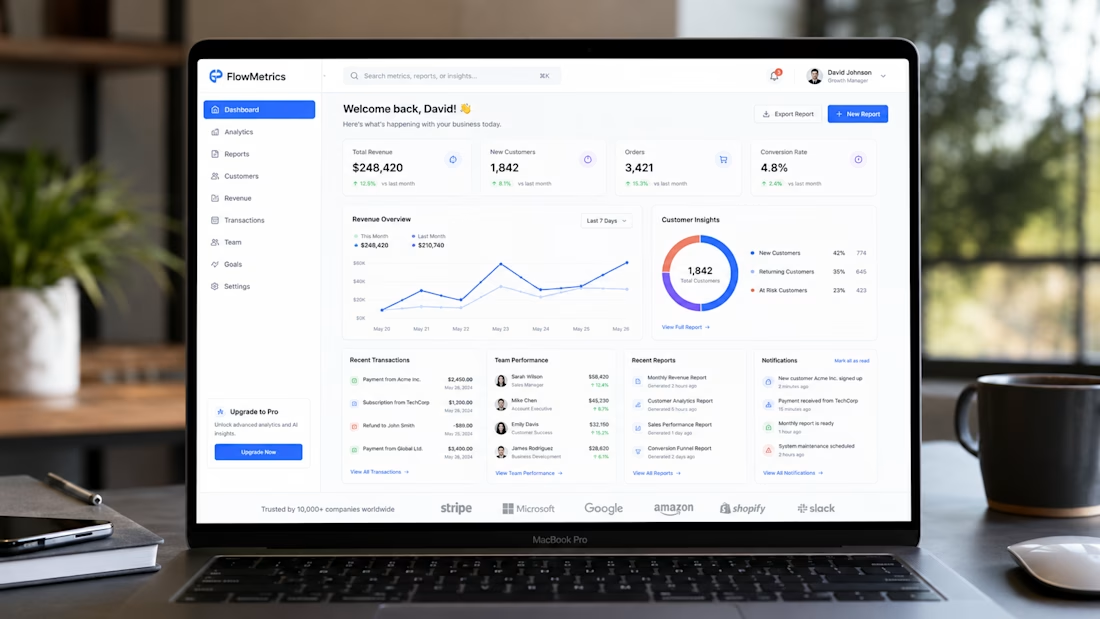


I think this a desktop application. Right?

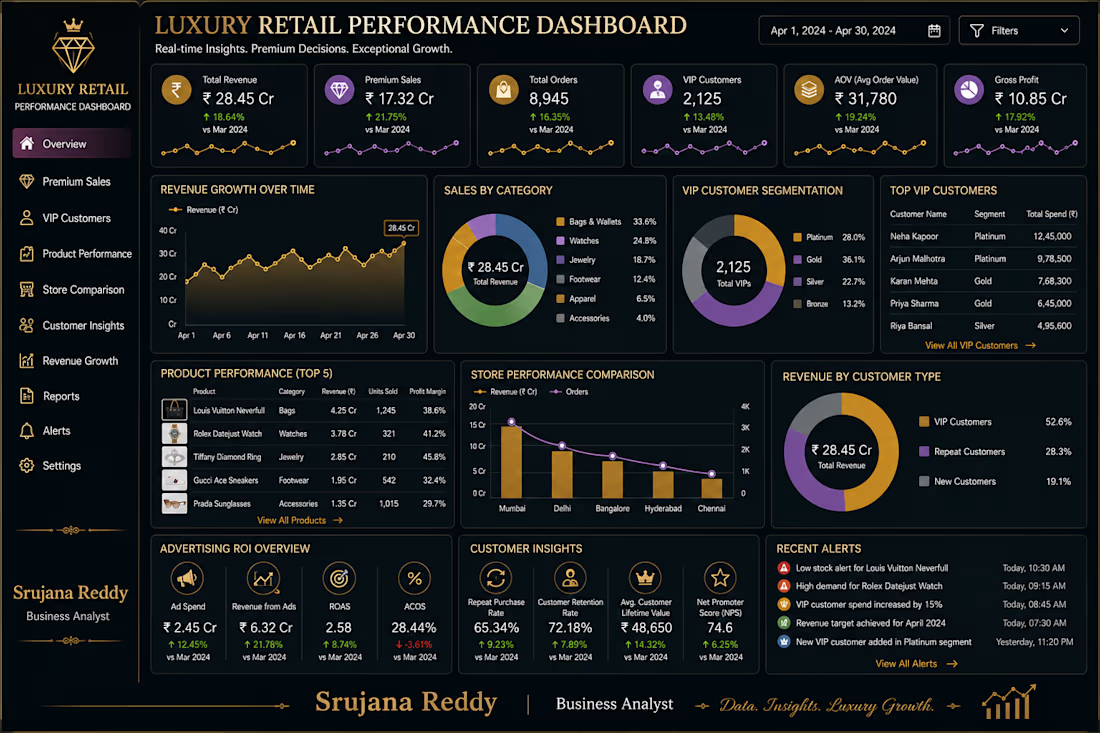
💎 Luxury Retail Performance Dashboard
Description:
Built a professional Luxury Retail Performance Dashboard to help premium retail brands monitor sales performance, understand VIP customer behavior, compare store performance, and drive revenue growth through data-driven insights.
This dashboard provides a comprehensive overview of Premium Sales, VIP Customers, Product Performance, Store Comparison, Revenue Growth, and Customer Insights, enabling luxury retailers to identify high-performing products, evaluate store performance, analyze customer purchasing behavior, improve customer retention, and maximize profitability.
Developed using Microsoft Power BI, SQL, and Microsoft Excel, the dashboard features executive-level KPI cards, interactive visualizations, premium customer segmentation, sales trend analysis, store comparison reports, and dynamic performance metrics. It transforms complex retail data into actionable business intelligence, empowering organizations to deliver exceptional customer experiences and make strategic business decisions.
Key Features
💎 Premium Sales Performance Analysis
👑 VIP Customer Insights & Segmentation
🛍️ Luxury Product Performance Tracking
🏬 Store Comparison & Benchmarking
📈 Revenue Growth & Profitability Analysis
📊 Executive KPI Dashboard with Interactive Reports
Client Note
Looking for a customized Luxury Retail Performance Dashboard tailored to your business? I design premium, executive-level Business Intelligence dashboards that transform complex retail data into meaningful business insights. Every dashboard is customized to your business objectives, helping you monitor premium sales, understand VIP customer behavior, compare store performance, optimize product strategies, and accelerate revenue growth. If you're looking for a high-quality, professional dashboard that combines elegant design with actionable analytics, I'd be happy to build a solution that supports your business goals and delivers measurable value.



📊 Interactive Sales Dashboard - Microsoft Excel
Interactive Excel Sales Dashboard featuring KPI tracking, sales trend analysis, and dynamic filtering to transform raw sales data into clear, actionable business insights.