The network for creativity
Join 1.25M professional creatives like you
Connect with clients, get discovered, and run your business 100% commission-free
Creatives on Contra have earned over $150M and we are just getting started
Back to feedPost
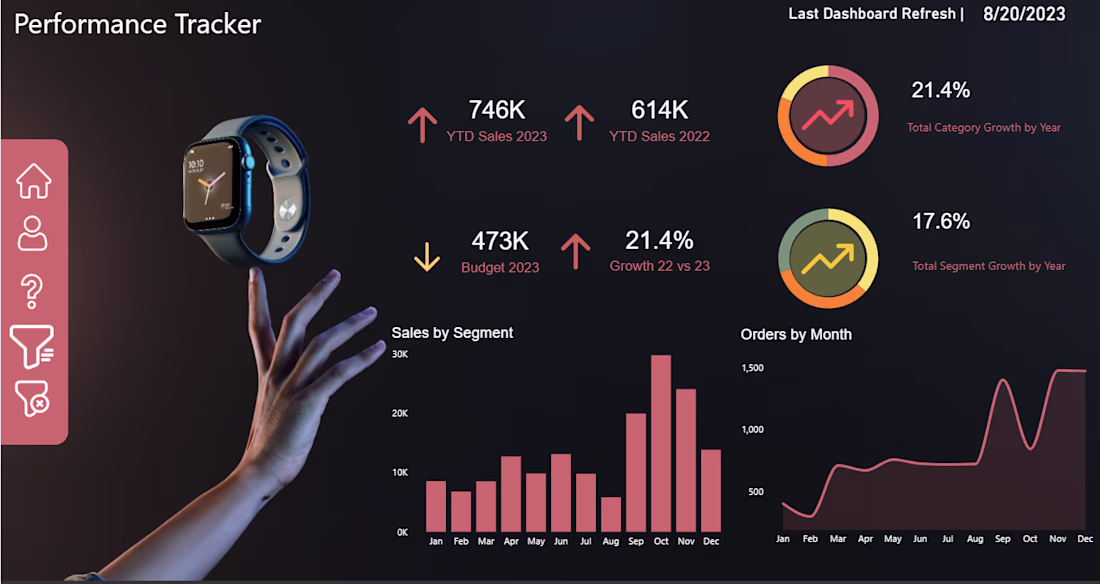
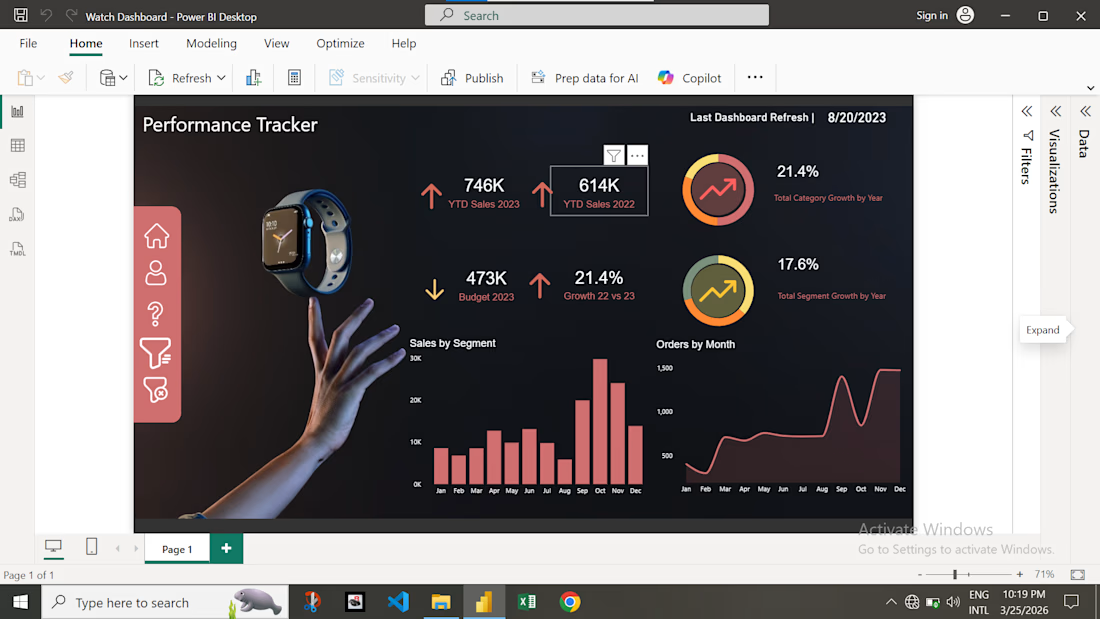
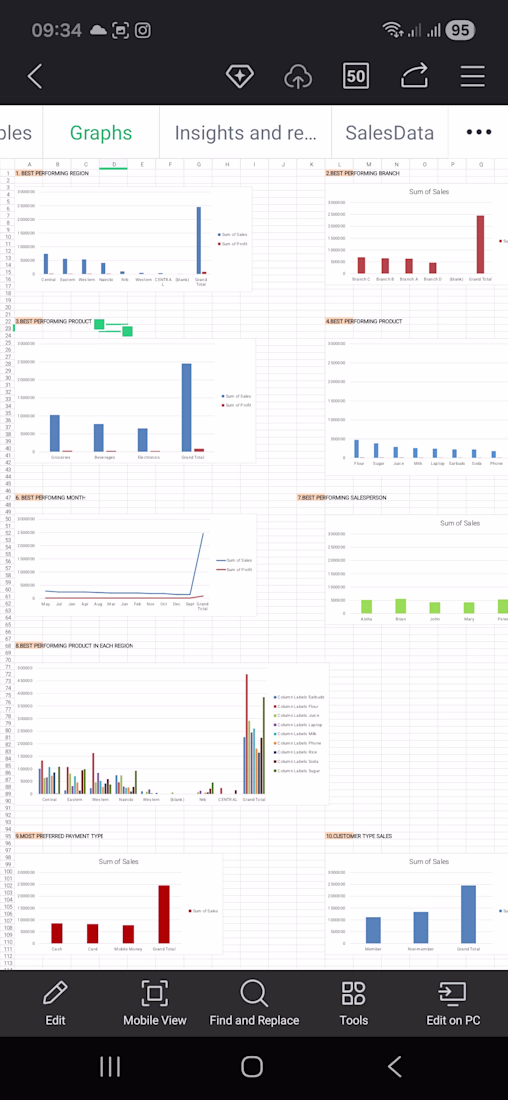
Dashboard Description – Performance Tracker
This Performance Tracker Dashboard presents a consolidated view of annual sales performance, growth indicators, and operational trends for a smartwatch product line.
At the top, key Year-to-Date (YTD) KPIs—including Sales 2023, Sales 2022, and Budget 2023—are highlighted with directional indicators to show progress and variance. The dashboard also visualizes category-level and segment-level growth rates through circular progress visuals, making year-over-year performance immediately understandable.
Sales by Segment is displayed through a monthly bar chart, showing how different periods contribute to total revenue.
Orders by Month uses a smooth line graph to track order volume trends, highlighting seasonal peaks and demand patterns.
The network for creativity
Join 1.25M professional creatives like you
Connect with clients, get discovered, and run your business 100% commission-free
Creatives on Contra have earned over $150M and we are just getting started
Related posts
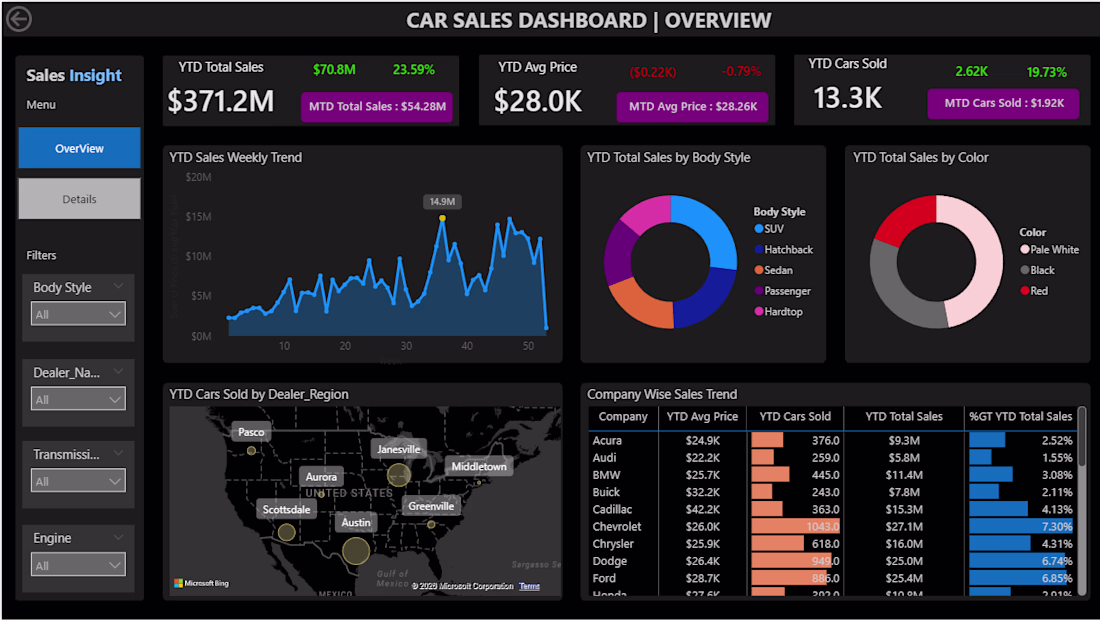
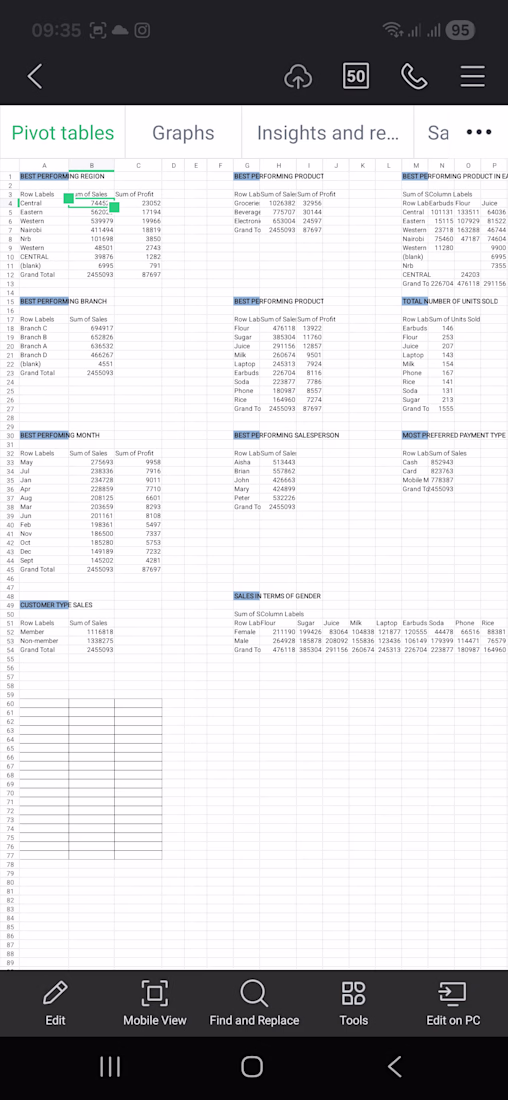
Interactive Car Sales Analytics Dashboard | Power BI
Description
This Power BI dashboard provides a comprehensive analysis of car sales performance, enabling businesses to monitor KPIs, identify trends, and make data-driven decisions.
Key Features
Interactive KPI cards for Total Sales, Average Selling Price, and Cars Sold
Year-to-Date (YTD) and Month-to-Date (MTD) performance tracking
Weekly sales trend analysis
Sales breakdown by Body Style and Vehicle Color
Dealer-wise sales performance with geographic visualization
Company-wise sales comparison with revenue and growth metrics
Dynamic filters for Body Style, Dealer Name, Transmission Type, and Engine Type
Skills Used
Power BI
Power Query
DAX Measures
Data Modeling
KPI Dashboard Design
Interactive Reporting
Business Intelligence
Business Value
This dashboard helps automotive businesses monitor sales performance, identify top-performing dealers and vehicle categories, track revenue growth, and support strategic sales decisions.
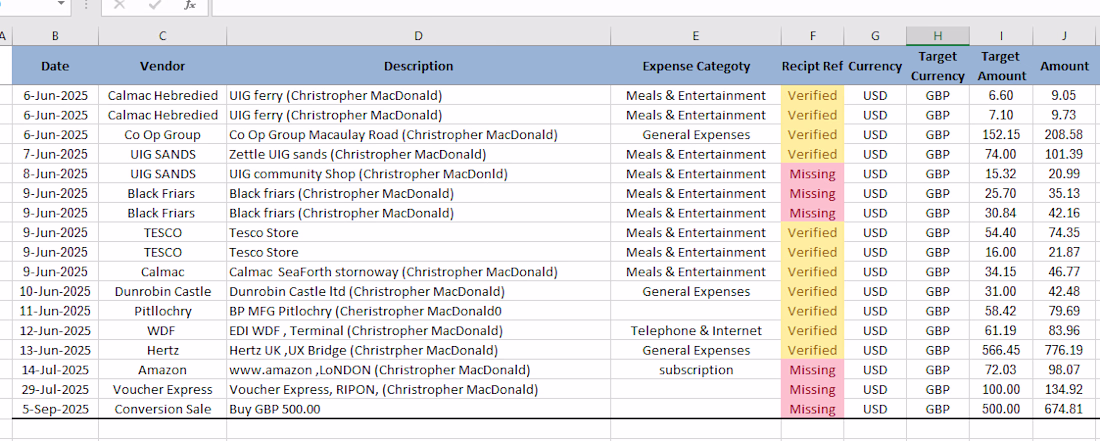
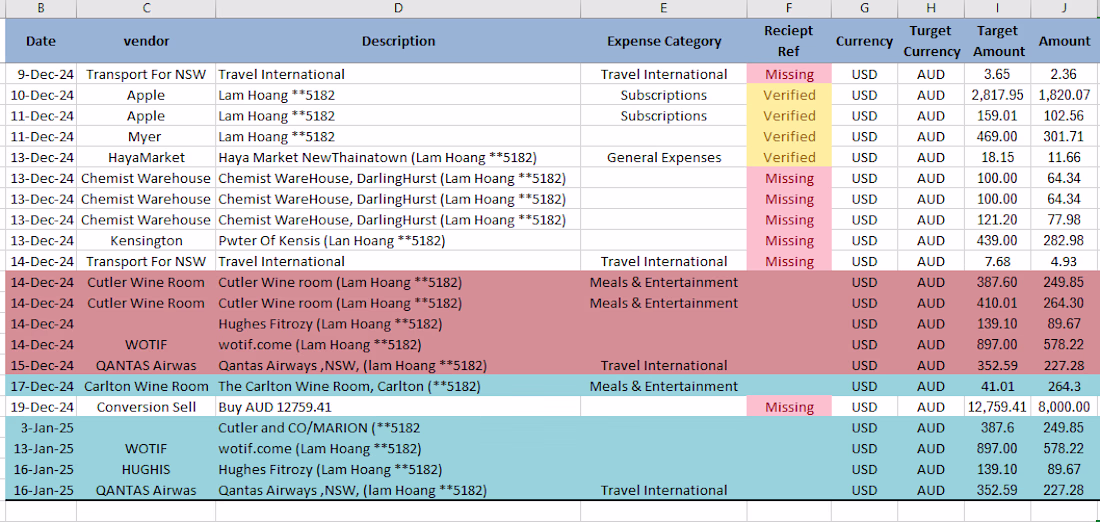
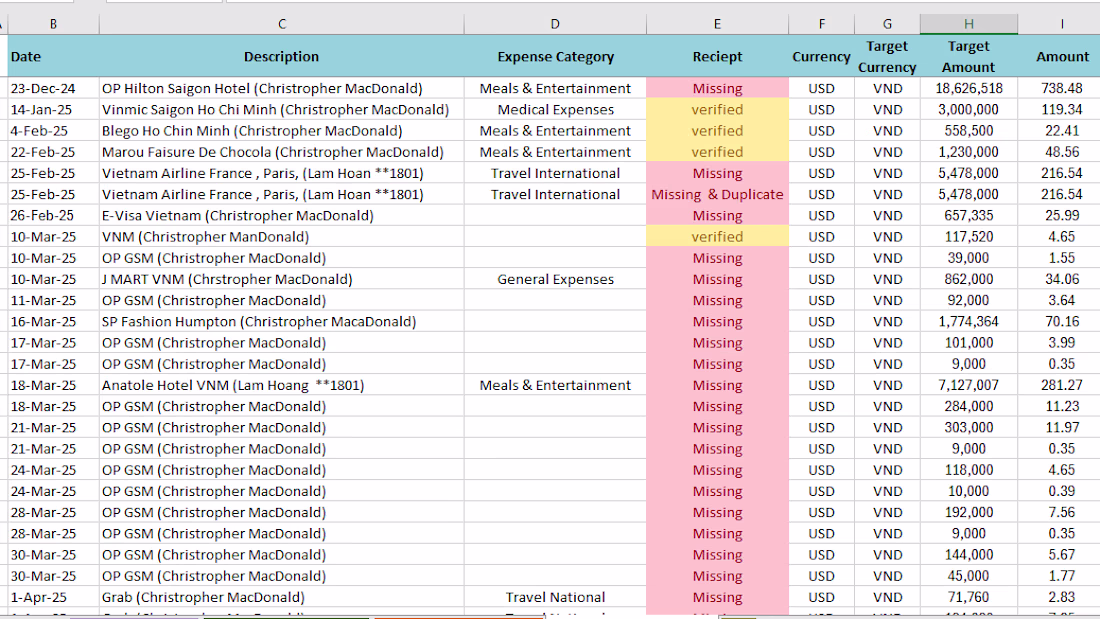
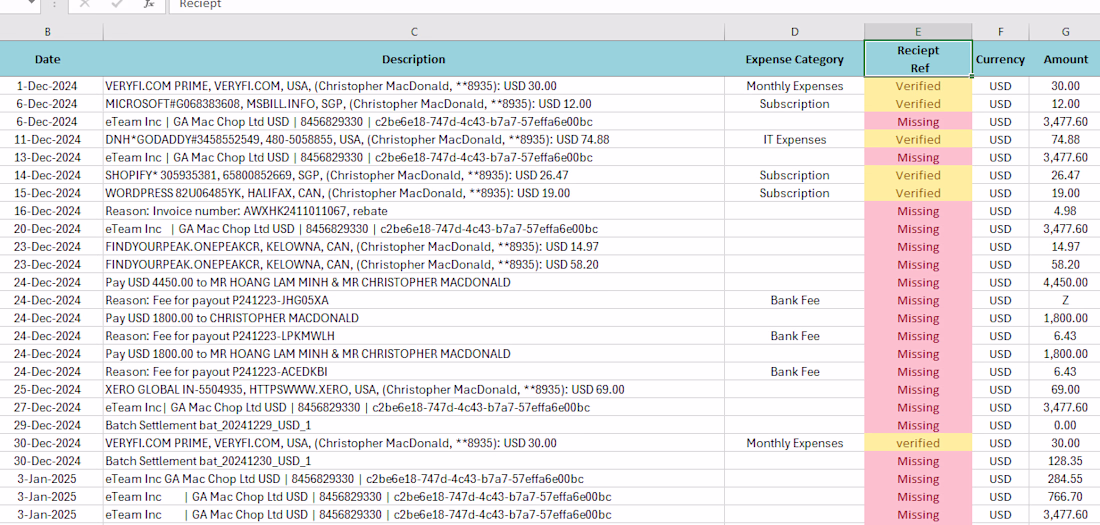
👋 Hey Contra fam, excited to be here!
I recently took on a messy currency reconciliation project. The client had receipts in 5 different currencies completely unorganized and hard to track.
I reconciled all receipts with the recorded expenses, cleaned the data, categorized everything properly, and delivered well-organized Excel sheets for each currency.
Now the client can easily track expenses, spot issues, and maintain clean records going forward.
Here are some glimpses:
If you’re dealing with messy financial data, multiple currencies, or expense tracking chaos , I can help organize it.
Would love to hear: What’s the biggest data/expense headache you’ve faced in your business?
#Finance #Bookkeeping #DataOrganization #Excel #VirtualAssistant #ExpenseManagement
Trending
Claude
Claude has entered the design space. How are you using Claude Design?
Contra University
Learn from expert creatives how to earn more using next-gen AI tools.
fifaworldcup2026
The World Cup is here and the whole world's watching. How are you designing for the world stage?
creativeaiflow
Creative AI workflows are evolving. What tools do you use, and what are their strengths and weaknesses?
freelancerlife
Freelancer life is wins, pivots, and everything in between. What’s yours right now?