The network for creativity
Join 1.25M professional creatives like you
Connect with clients, get discovered, and run your business 100% commission-free
Creatives on Contra have earned over $150M and we are just getting started
Back to feedPost

A SaaS client's dashboard was taking 4.2 seconds to render every time a user logged in.
The user base was growing, but user retention was dropping. Users were literally refreshing the browser thinking the app had frozen.
Here is how we diagnosed and fixed the issue in a single afternoon dropping query times from 4,200ms to 85ms:
The Diagnosis (Laravel Debugbar & Telemetry) We ran a query trace on the dashboard endpoint. The culprit? A classic nested Eloquent loop pulling customer transaction metrics. Instead of 1 optimized query, the server was executing 180+ database queries per request (the dreaded N+1 problem).
The Fix: Eager Loading & Database Aggregates
Replaced individual loop queries with Eloquent's with() for eager loading.
Replaced memory-heavy PHP array manipulation ($user->orders->sum()) with native database aggregation using withSum() and withCount().
Strategic Indexing We checked the MySQL execution plan (EXPLAIN) and found the transactions table was running full-table scans across 500,000+ rows because user_id and created_at lacked composite indexing. Added a single composite index: $table->index(['user_id', 'created_at']);
The Result:
Database Queries: Reduced from 184 to 3.
Page Response Time: Dropped from 4.2s to 85ms.
Server Load: CPU usage dropped by 65%.
You rarely need expensive server upgrades or a complete system rewrite to fix a slow application. Most of the time, you just need to fix how your code talks to your database.
How fast is your primary user dashboard loading right now?
The network for creativity
Join 1.25M professional creatives like you
Connect with clients, get discovered, and run your business 100% commission-free
Creatives on Contra have earned over $150M and we are just getting started











Related posts

Built SpeedPulse AI — an automated website performance teardown and local client acquisition engine.
Most local businesses lose over 35% of their mobile conversions due to slow load times and missing Google SEO schema. Auditing each client manually took hours, so I automated the entire process on Base44:
⚡ Real-time Core Web Vitals, Local SEO & UX friction score dials
🔄 Dynamic Before/After sprint projections (gliding scores from 45 to 91+)
📄 Automated Executive PDF brief generation
🤖 Built-in Agency CRM that captures incoming leads, tracks stages, and auto-drafts client proposals with one-click copy
Live App: https://speedpulse-flow.base44.app


Lookin back at last year, for one project we had 6 working days to rebuild Human AI Academy's site before a launch.
The old site scored 45/100 on performance and took 6.2 seconds to load. With a launch about to send thousands of people to one page, that was the real risk. Not the design.
So speed came first. We built 30+ custom Framer components and kept every section light enough to load fast on launch day.
The result: 94/100 on performance, 1.8s load time, and launch week took them from 4,000 to 12,000 students.
What I keep relearning: on launch week, the page doesn't need to be clever. It needs to load before people lose interest.

That performance jump is impressive, especially with only six working days. A fast-loading site can make a real difference when a launch brings in thousands of visitors.


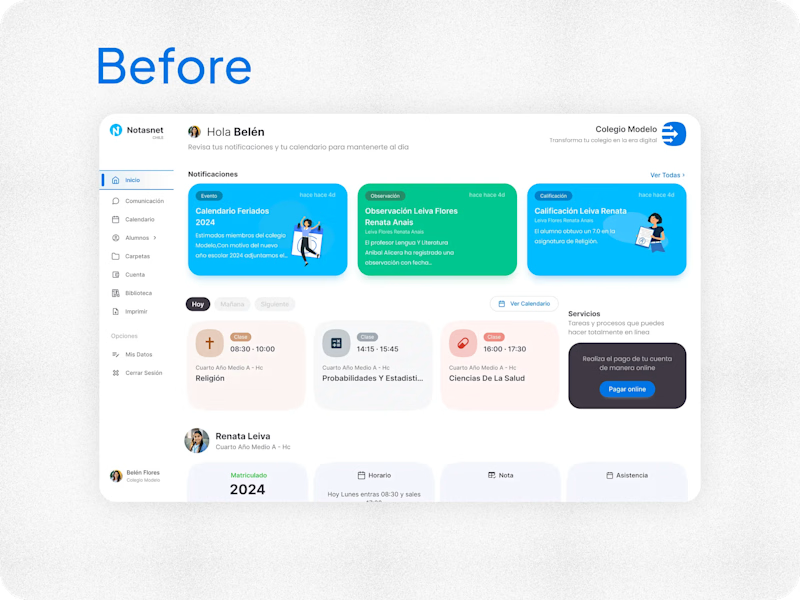
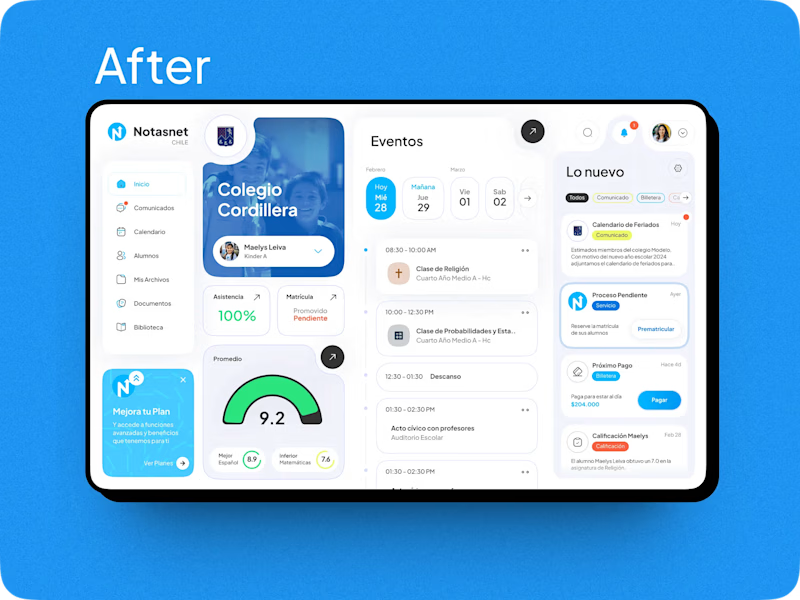

After absolutely it's more practical 🎉🎉🔥🔥