The network for creativity
Join 1.25M professional creatives like you
Connect with clients, get discovered, and run your business 100% commission-free
Creatives on Contra have earned over $150M and we are just getting started
Back to feedPost

Before → After: a real estate listing flyer redesign 🏡
The goal was to make the listing easier to read at a glance:
Clear hierarchy, so price and "Just Listed" stand out first
Consistent brand colors across the whole layout
Clean listing cards for the other properties
A strong call to action with the phone number easy to find
Small layout changes can make a big difference in how fast a buyer gets the key info.
Real estate agents, how do you usually promote new listings: flyers, social posts, or both?
The network for creativity
Join 1.25M professional creatives like you
Connect with clients, get discovered, and run your business 100% commission-free
Creatives on Contra have earned over $150M and we are just getting started



Related posts

Hey guys,
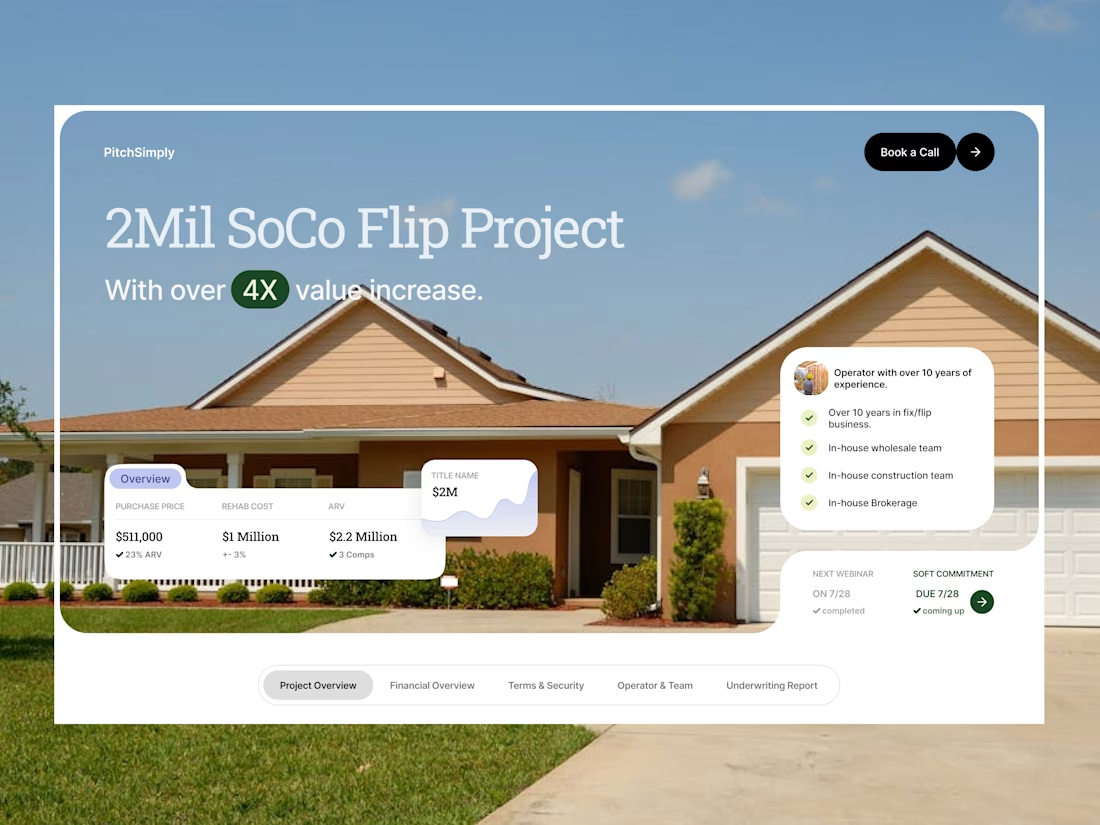
Welcome the new work - investor pitch landing page for real estate industry. The goal was simple: get investors from landing on the page to booking a call. I kept it focused, proof and the ask up top, no fluff.


investor pages need this clarity

How much of a product should someone be able to explore before they book a demo?
That was the UX question behind this site for contact center software.
The comparison cards use the same five criteria in the same order. You can pick a row and scan across all three options.
The coverage toggle keeps the grid in place while the cells, legend and summary update. Your eye stays on the same part of the grid as the view changes.
My favourite detail is in the six-tab product preview. Pick a scoring criterion and the call excerpt and timestamp update right beside the score.
On mobile, the featured comparison card moves to the top and the demo tabs become a horizontal strip.
If you could keep just one interaction here, which would you choose and why: the coverage toggle or the scoring preview?
#B2BWebDesign #InteractionDesign #LandingPageDesign


Matching the comparison rows is so thoughtful.

Real estate decks are some of my favourite to design. The product already looks good on camera, so the photos carry half the story. The tricky half is the numbers: rental yields and prices per listing have to sit next to a glossy Dubai skyline without killing the mood.
For Elevate Realty I made the numbers visual too. Instead of a plain "93% client satisfaction", the slide shows 100 small figures with 7 of them left grey. Your eye finds the grey ones before it reads the number.
Do you like working with real estate clients?
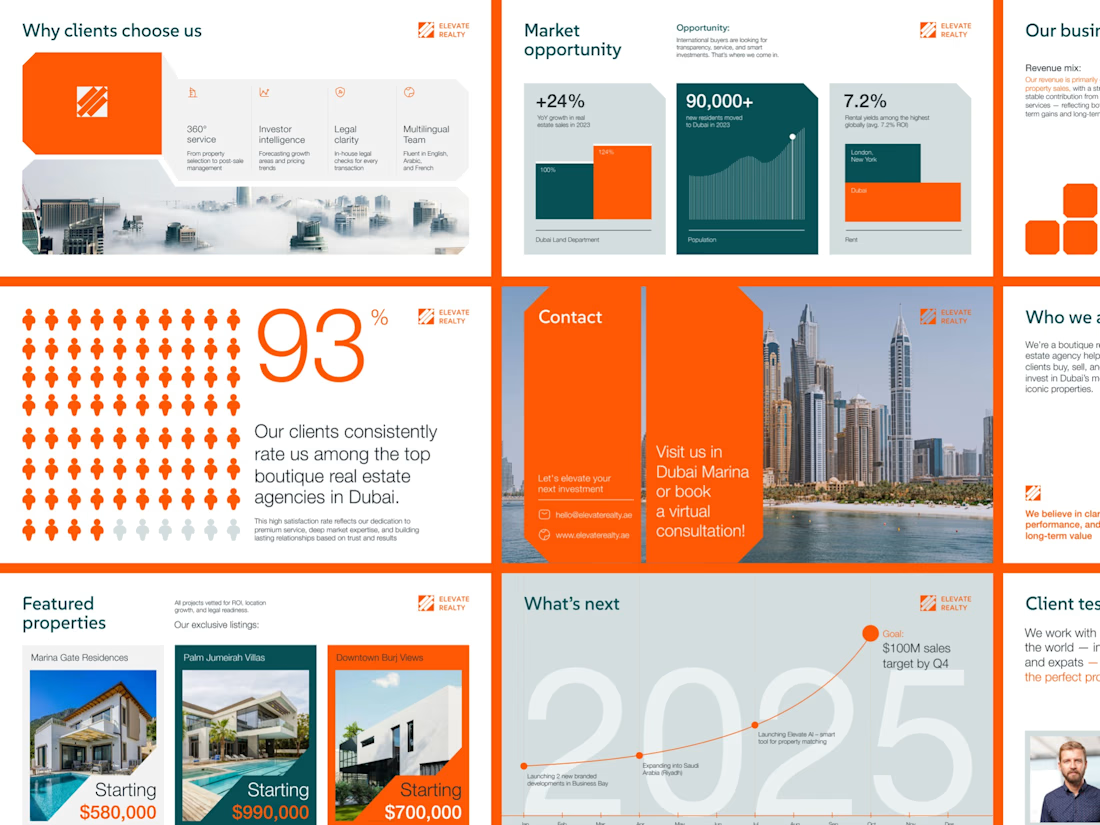

Love the 93 percent visual, 100 small figures with 7 left grey makes the number land in a way a plain stat never does. Real estate clients definitely respond to that kind of clarity.