The network for creativity
Join 1.25M professional creatives like you
Connect with clients, get discovered, and run your business 100% commission-free
Creatives on Contra have earned over $150M and we are just getting started
Back to feedPost
TIGERS vs RAVENS
A basketball broadcast package built in Rive. It covers both places graphics show up during a game: the screens inside the arena, and the TV feed going out to everyone else.
The arena side has a game day opener, a three point celebration and win sequences. Each is built twice, once for the main centre hung screen and once for the ribbon boards that wrap the balcony.
The broadcast side has a score bug, lower thirds, a live leaderboard and a stat comparison panel.
I have wanted to try this kind of heavy sports typography for a long time and never had a reason. This was the excuse.
What I was actually chasing was an experience, not a set of elements. Score bugs and lower thirds are the easy part of a package like this. I wanted whole pieces of video that rewrite themselves while they play. A celebration that becomes a different player. A win sequence that becomes the other team. Not a template you re-render for each version, but video that personalises itself in real time. That part worked better than I expected.
Nothing is typed into an artboard. Player names, numbers and stats live in a PlayerVM. Colours, logos and team names sit in view models next to it.
So there is no Tigers version and no Ravens version of anything. There is one version and two sets of data. Switching teams takes a couple of minutes.
The three pointer shows it best. The main screen and the ribbon read from the same view model, so changing the player updates both at once. You can watch the ribbon change in the video while I never open that file.
The comparison panel takes two raw numbers and works out the bar lengths by comparing them against each other, so the leading team always fills its bar. Scale against a fixed maximum instead and low count stats like steals turn into two identical stubs.
It also flips for stats where lower is better.
Elsewhere, scripts run the game and shot clocks, reorder the leaderboard when points change, stagger the comparison rows in, and handle the glow and grain live on GPU canvas instead of baking them in.
WHAT DID NOT MAKE IT
An operator panel. Preview and program, a button per graphic, thumbnails of what is queued next. Everything already runs off data, so it is not really a technical problem. I just ran out of time. It is the first thing I will build on top of this.
Built with Scripting, GPU Canvas, Data Binding, Component Lists, Layouts, Joysticks, State Machines and Components.

Full case study, with the videos and a closer look at how it works:
https://contra.com/p/XPUEbM3E-tigers-vs-ravens-live-basketball-broadcast-packag
I also finished the operator panel I mentioned here. It can fire takes, run the score and clocks, edit player data, swap team profiles, set comparison stats and position graphics live.
The network for creativity
Join 1.25M professional creatives like you
Connect with clients, get discovered, and run your business 100% commission-free
Creatives on Contra have earned over $150M and we are just getting started
Trending
retrofuturism
Share your favorite designs from the past exploring the distant future. Or your own take on the aesthetic 🚀
halftone
Dots. Texture. Grain. Let's see your designs using the halftone technique.

Midjourney
Creatives are showing off what they're making with Midjourney.
colorgrade
Video editors sound off: How do you enhance the mood of your video in color grading?





Related posts

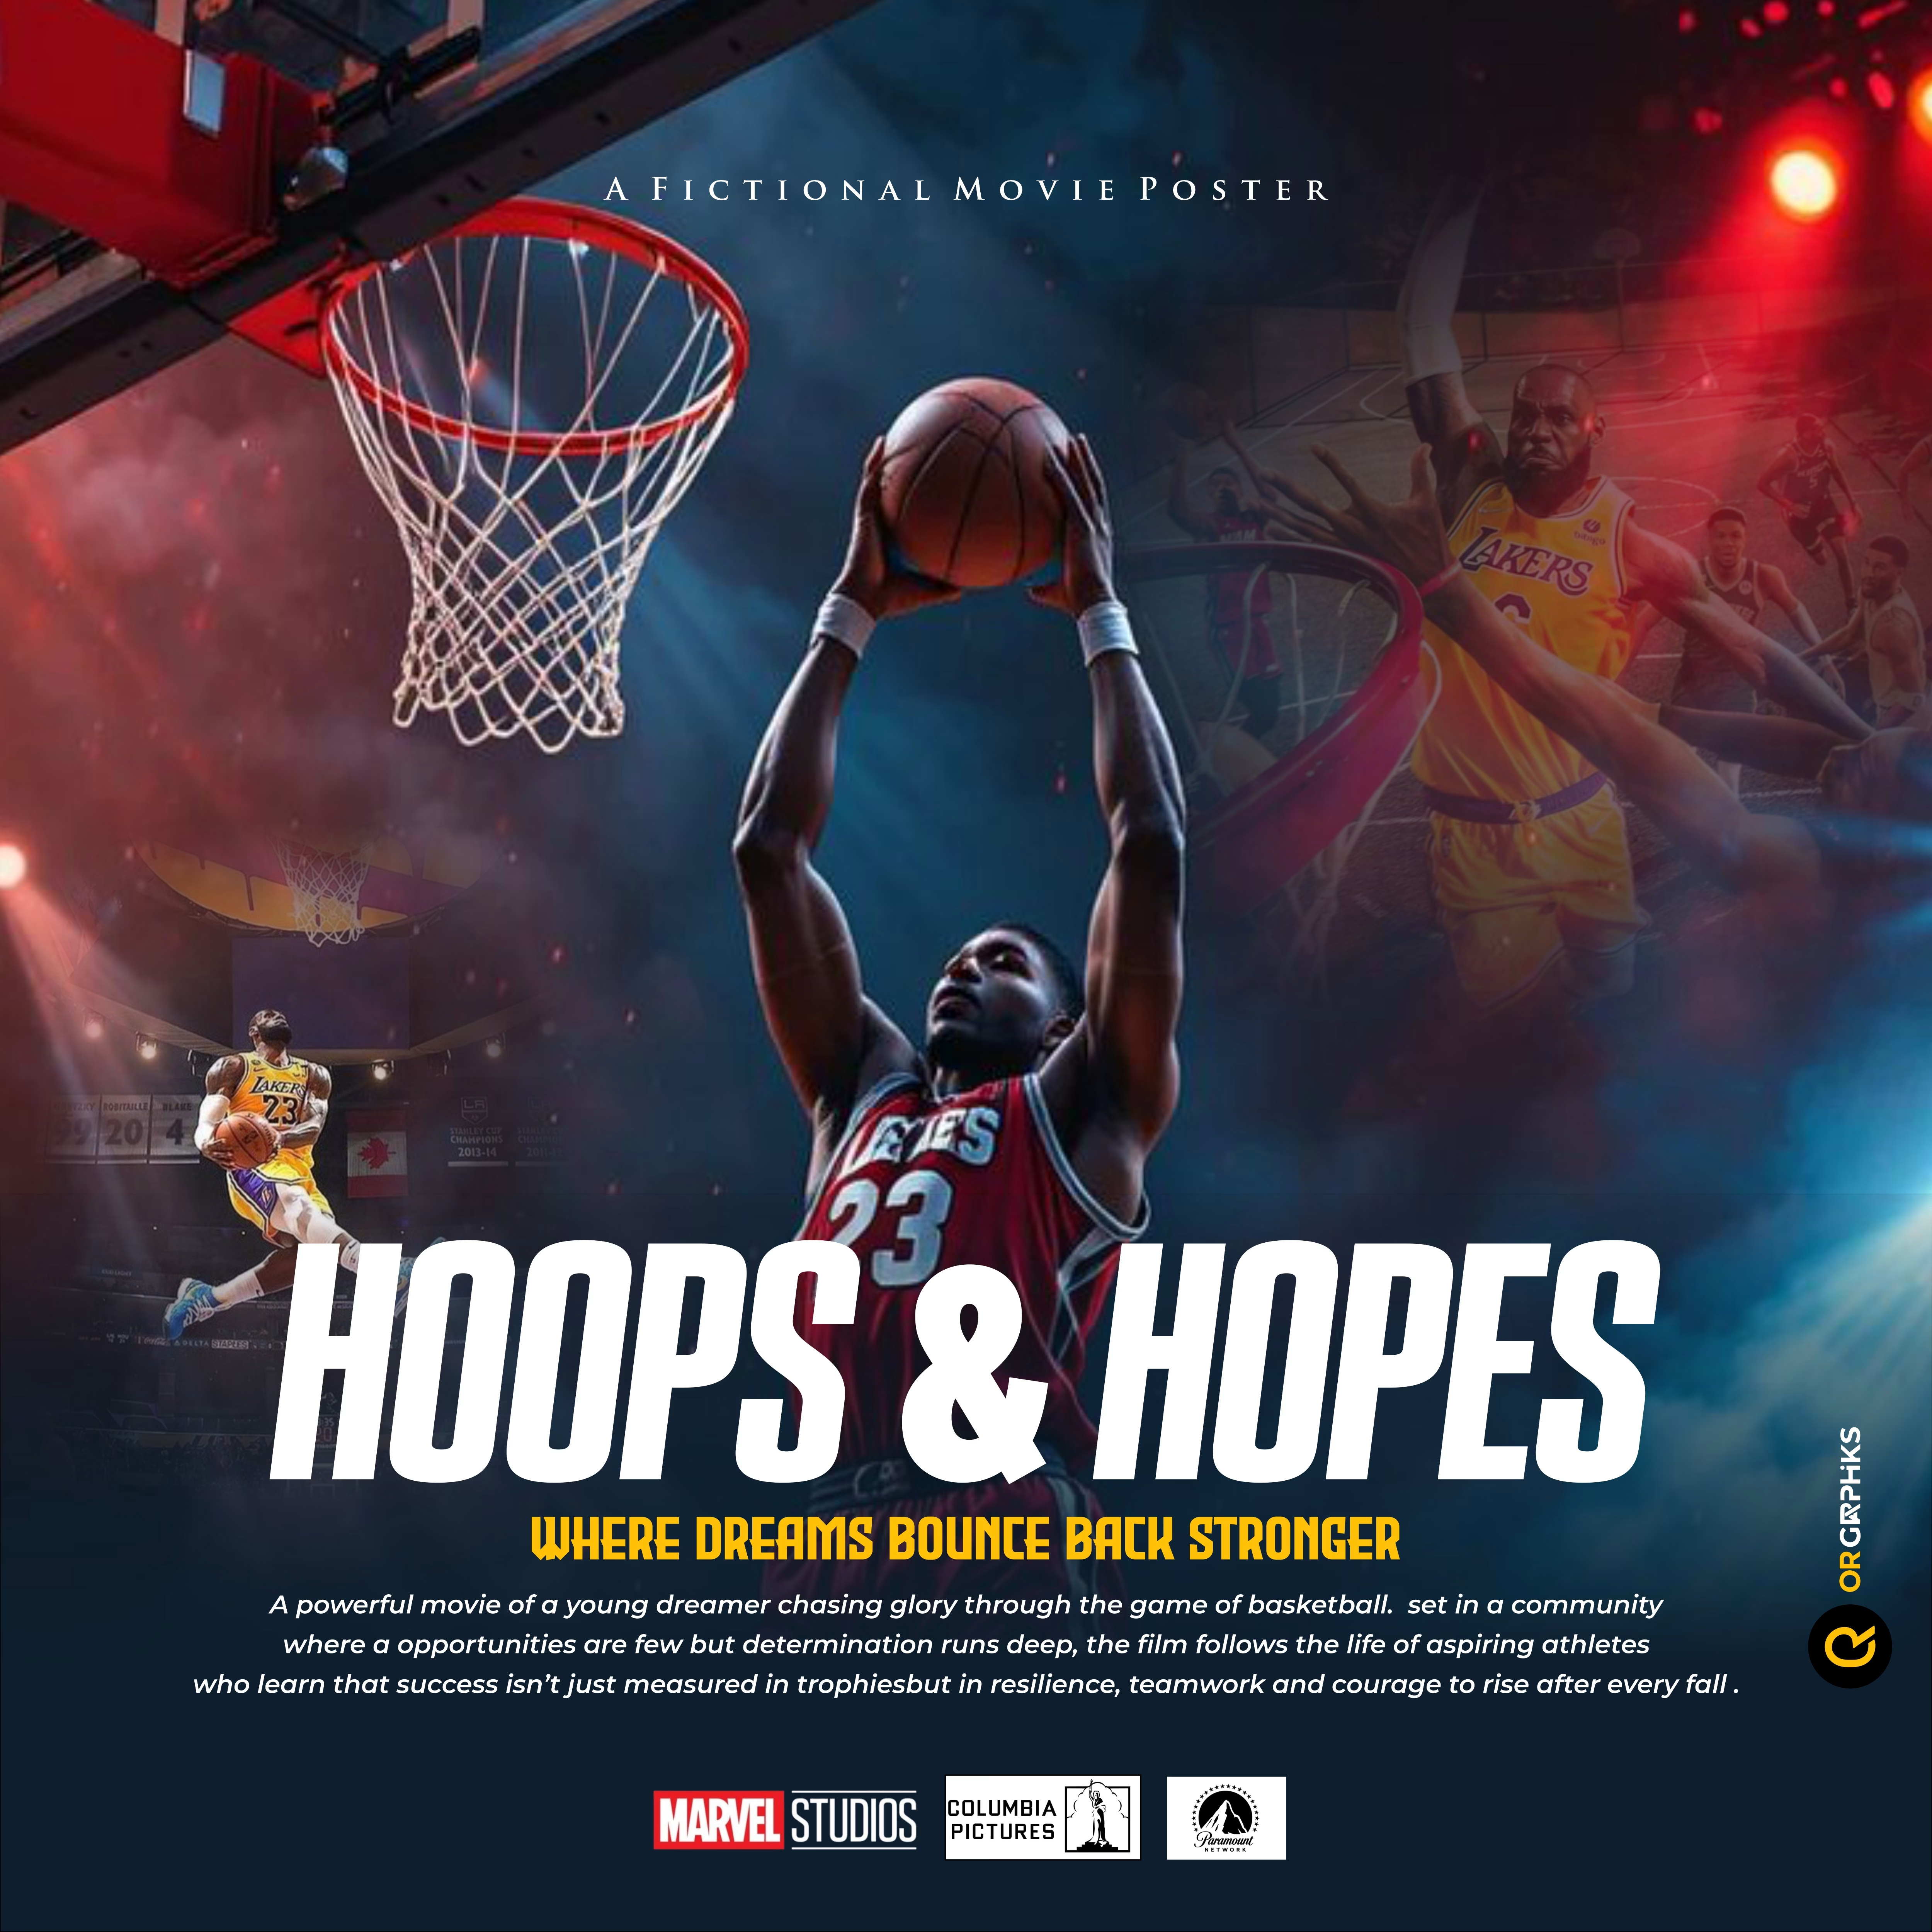
Hoops & Hopes — Fictional Movie Poster
Hoops & Hopes is a cinematic basketball movie poster concept built around the themes of dreams, resilience, determination, and overcoming adversity.
The design uses a dramatic basketball action scene as the central visual, with the athlete reaching toward the hoop to represent the pursuit of greatness. The layered imagery of basketball players and courts creates a sense of legacy, competition, and the journey from struggle to success.
The dark blue and red cinematic lighting gives the poster an intense, emotional atmosphere, while the bright yellow subtitle creates a strong visual contrast and reinforces the energy associated with basketball.
The bold “HOOPS & HOPES” title dominates the composition, making the movie immediately recognizable while communicating both sides of the story: the game itself (Hoops) and the dreams behind it (Hopes).
The tagline, “WHERE DREAMS BOUNCE BACK STRONGER,” reinforces the core message of resilience — that failure isn't the end, but an opportunity to rise again.
The supporting description establishes the narrative of young athletes pursuing success despite limited opportunities, emphasizing resilience, teamwork, courage, and determination.
Overall, the poster was designed to feel cinematic, inspirational, energetic, and emotionally powerful, appealing to audiences who enjoy sports, coming-of-age stories, and motivational films.


Amazing work!

Zoomed in because the small stuff deserves a look too.
Every card, icon, and spacing decision here was intentional, up close is where you actually see it.

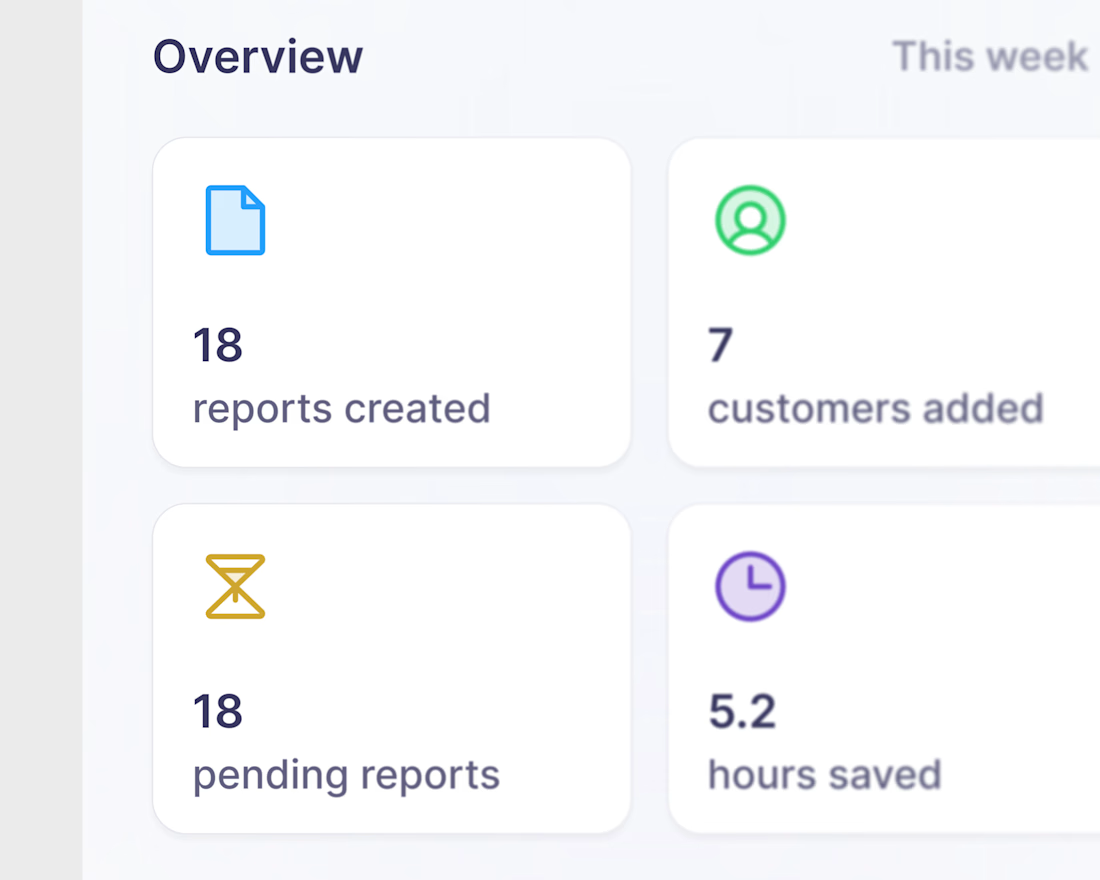
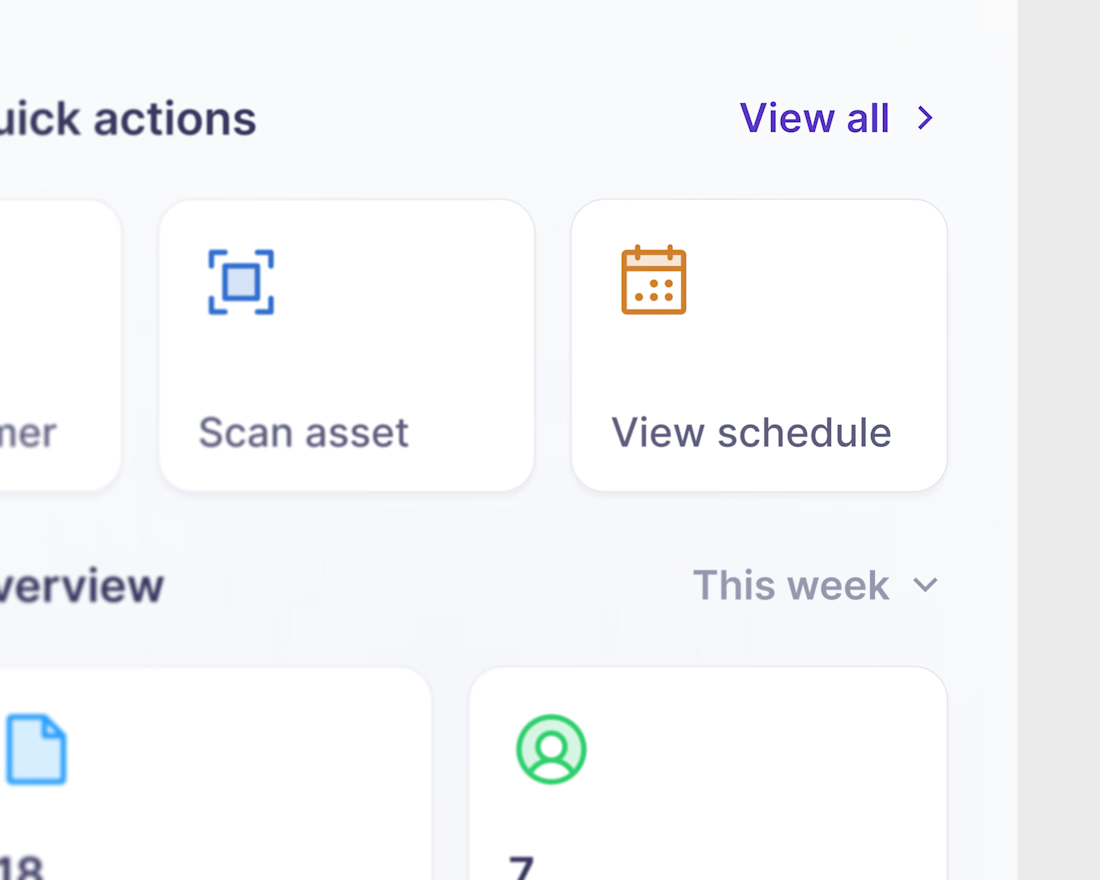
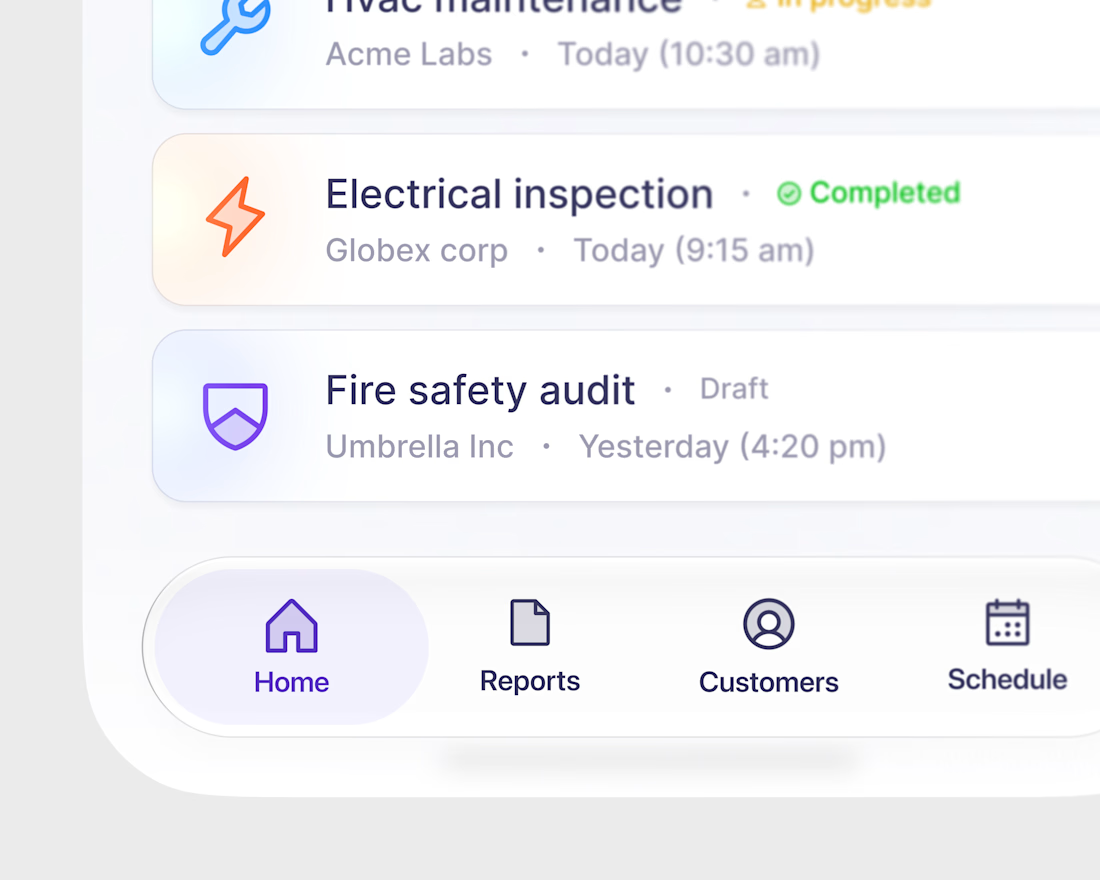
Attention to detail is one of the most important parts of our work. We care about the small details that clients may never consciously notice, but those details are often what make the final result feel polished and professional.

Every brand is paying editors to render the grid takeover effect. I made it run live in Framer.
Any clip, cut out in the browser, tiles rebuilt in real time. Hover it and the grid reacts. A video can't do that.
https://gridmosaic.framer.website/
wow, amazing job!