The network for creativity
Join 1.25M professional creatives like you
Connect with clients, get discovered, and run your business 100% commission-free
Creatives on Contra have earned over $150M and we are just getting started
Back to feedPost
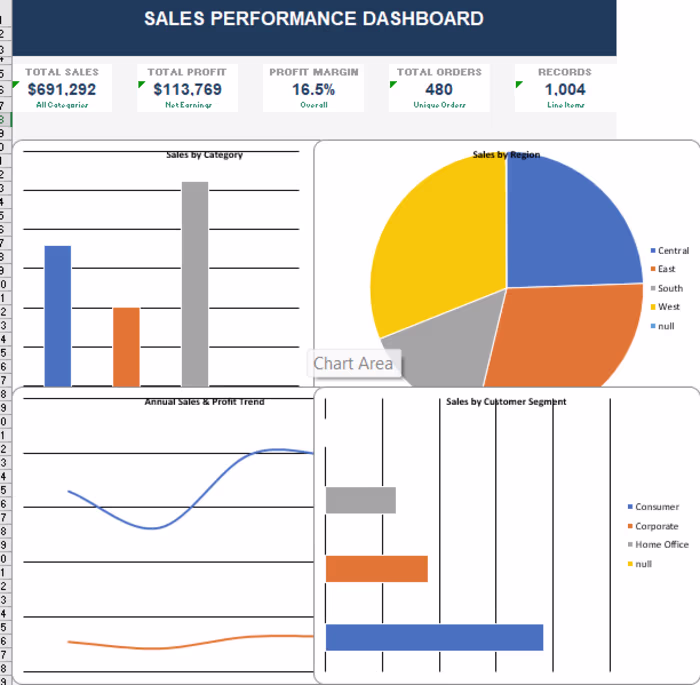
A complete sales dashboard built in Excel using 1,000+ real retail records. Includes KPI summary cards for total sales, profit, and margin, four charts covering category, region, annual trend and customer segment, and pivot tables for quick data summarization. Built for business owners and teams who need a clear view of their numbers without complexity.
The network for creativity
Join 1.25M professional creatives like you
Connect with clients, get discovered, and run your business 100% commission-free
Creatives on Contra have earned over $150M and we are just getting started
Related posts
Building a brand new AI Fintech dashboard components
WIP :)
Superb!
Full-Stack SaaS Analytics Dashboard with Next.js, Node.js, and Supabase
This is a full-stack SaaS-style analytics dashboard built with React/Next.js on the frontend, Node.js on the backend, and Supabase for database management and backend services. The application includes a modern responsive interface, sidebar navigation, KPI cards, revenue analytics, sales performance views, marketing insights, charts, tables, and business reporting sections.
Tech Stack: React, Next.js, Node.js, Supabase, JavaScript/TypeScript, REST API, responsive UI components, database-driven dashboard architecture, and full-stack web application development.
The frontend was developed with a reusable component-based structure to keep the interface clean, scalable, and easy to maintain. The backend uses Node.js to handle API logic, server-side operations, and communication between the application and database. Supabase is used for structured data storage, authentication-ready architecture, and scalable database operations.
Overall, this project demonstrates my experience in building complete full-stack web applications, including frontend UI development, backend API integration, database management, analytics dashboard design, and scalable SaaS application architecture.
🔗 Project Link
📝 What I Built
I built a Cold Lead Reactivation Dashboard designed to help businesses reconnect with inactive leads and bring them back into active conversations. The dashboard uses AI-powered lead scoring, lead activity tracking, and personalized outreach workflows to help sales and marketing teams focus on the opportunities most likely to convert.
📸 Screenshots / Recording
I have uploaded an overview screen recording demonstrating the complete dashboard experience, workflow navigation, and key features. The recording provides a better understanding of the user journey and overall functionality than static screenshots alone.
🛠️ How I Used Stitch
I used Stitch to design and prototype the complete dashboard experience. It helped me quickly create the layout, dashboard structure, workflow visualization, KPI cards, analytics sections, and overall user interface. This allowed me to focus more on the business workflow and user experience while rapidly iterating on different design ideas.
💡 Feedback on Stitch
My experience with Stitch was very positive. It made it easy to turn an idea into a professional dashboard prototype in a short amount of time. The interface is simple to use, and the AI-assisted design process helped generate layouts and components much faster than building everything manually.
One feature I particularly liked was the ability to preview designs across different screen sizes. Being able to switch between Mobile, Tablet, and Desktop views made it much easier to visualize the user experience and ensure the design remained responsive across devices.
Overall, Stitch is a great tool for quickly exploring ideas, creating prototypes, and validating concepts before moving into development.
Forget good, this is exceptional on every level.
Trending
Claude
Claude has entered the design space. How are you using Claude Design?
Contra University
Learn from expert creatives how to earn more using next-gen AI tools.
creativeaiflow
Creative AI workflows are evolving. What tools do you use, and what are their strengths and weaknesses?
portfolioreview
The best portfolios tell a story, not just show a grid. Share yours for feedback.
freelancerlife
Freelancer life is wins, pivots, and everything in between. What’s yours right now?