Ready for work
Anshul is ready for their next project!
Canada
Tableau
Data Visualizer
Custom Map in Tableau
Data Analyst
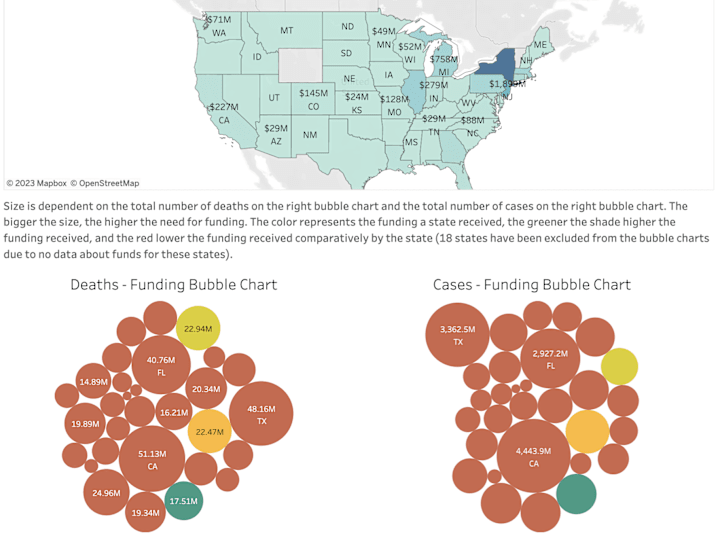
Covid 19 Dashboard
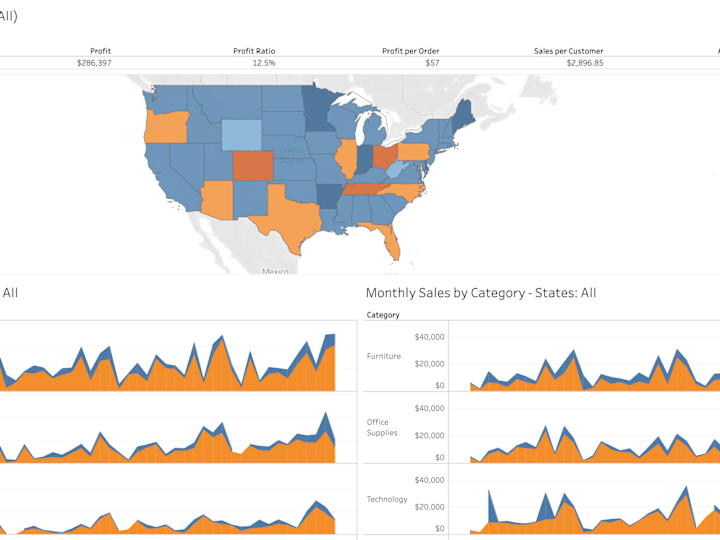
Sample Superstore Data Visualisation
Microsoft Excel
Python
+1
Data Visualization | Dashboarding
Contact for pricing
Google Docs
Product Data Analyst
+4
Data Analytics