
Transforming Raw Data into Actionable InsightsSUNDAY AMOO
I offer comprehensive data analysis services, leveraging advanced techniques and tools like Power BI to derive actionable insights from complex datasets. What sets me apart is my ability to not only analyze data but also communicate findings effectively, empowering clients to make informed decisions and drive business success through data-driven strategies.
What's included
Comprehensive Data Analysis Report
Executive Summary:
Concise overview of key findings and recommendations.
Data Exploration:
Summary statistics and visualizations to understand the structure and distribution of the data.
Descriptive Analysis:
Examination of trends, patterns, and relationships within the data.
Statistical Analysis:
Hypothesis testing, correlation analysis, and regression models to uncover deeper insights.
Visualization:
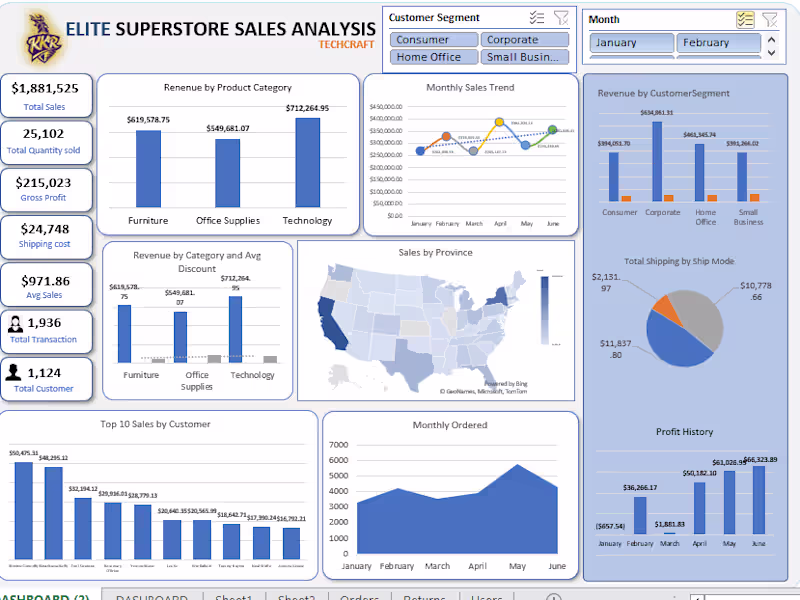
Interactive visualizations and dashboards created using Power BI or other tools for enhanced data exploration and communication.
Key Insights:
Clear and actionable insights derived from the analysis.
Recommendations:
Practical recommendations based on the insights to inform decision-making.
A comprehensive report that enables stakeholders to make informed decisions and drive business growth based on data-driven insights.
Delivery within [specified timeframe] after receipt of data and project briefing.
SUNDAY 's other services
Contact for pricing
Tags
MySQL
Data Analyst
Data Modelling Analyst
Data Scientist
Service provided by
SUNDAY AMOO Nigeria
Transforming Raw Data into Actionable InsightsSUNDAY AMOO
Contact for pricing
Tags
MySQL
Data Analyst
Data Modelling Analyst
Data Scientist
I offer comprehensive data analysis services, leveraging advanced techniques and tools like Power BI to derive actionable insights from complex datasets. What sets me apart is my ability to not only analyze data but also communicate findings effectively, empowering clients to make informed decisions and drive business success through data-driven strategies.
What's included
Comprehensive Data Analysis Report
Executive Summary:
Concise overview of key findings and recommendations.
Data Exploration:
Summary statistics and visualizations to understand the structure and distribution of the data.
Descriptive Analysis:
Examination of trends, patterns, and relationships within the data.
Statistical Analysis:
Hypothesis testing, correlation analysis, and regression models to uncover deeper insights.
Visualization:
Interactive visualizations and dashboards created using Power BI or other tools for enhanced data exploration and communication.
Key Insights:
Clear and actionable insights derived from the analysis.
Recommendations:
Practical recommendations based on the insights to inform decision-making.
A comprehensive report that enables stakeholders to make informed decisions and drive business growth based on data-driven insights.
Delivery within [specified timeframe] after receipt of data and project briefing.
SUNDAY 's other services
Contact for pricing