
Excel Reports & Interactive Dashboards That Tells Data StoryManigandan Acharya
Tired of staring at endless rows of raw data with no clear insight? I turn your messy spreadsheets into clean, interactive Excel dashboards and reports that actually make decisions easier.
Whether you're a startup tracking growth metrics, an e-commerce brand monitoring sales performance, or a manager presenting to stakeholders — I design dashboards that are visual, intuitive, and built to impress.
━━━━━━━━━━━━━━━━━━━━━━
🔷 WHAT YOU GET
━━━━━━━━━━━━━━━━━━━━━━
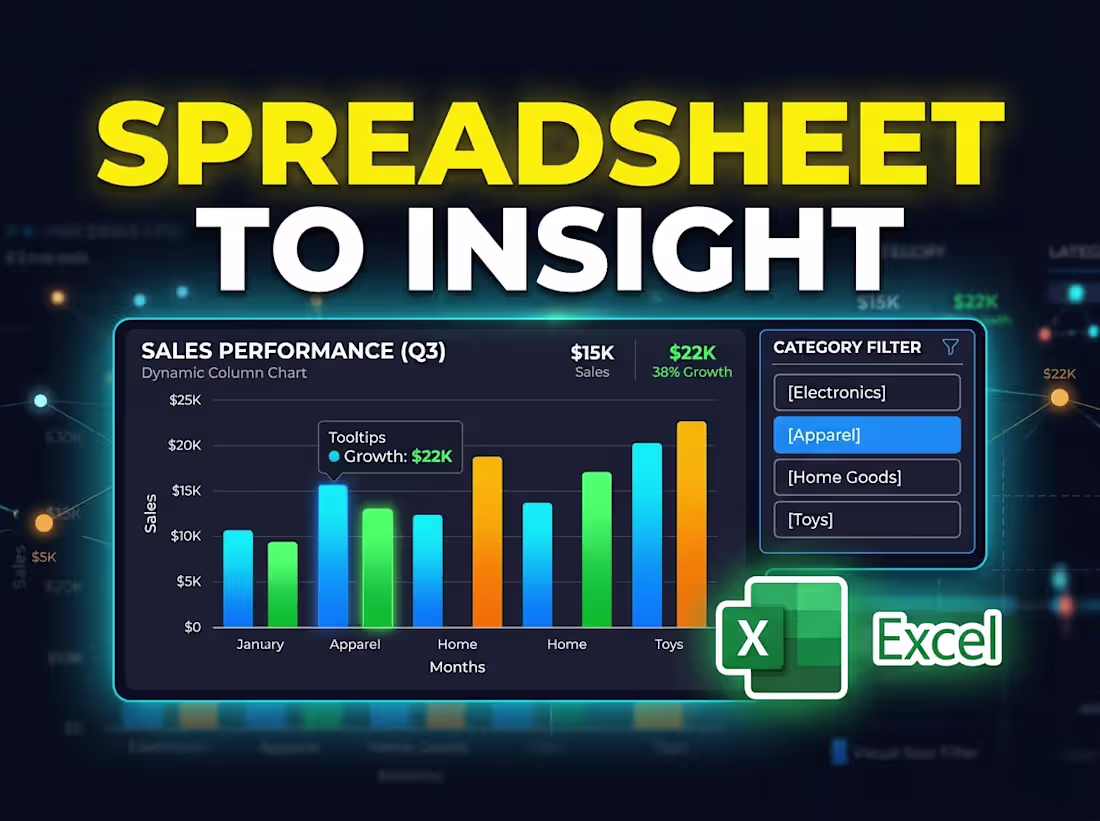
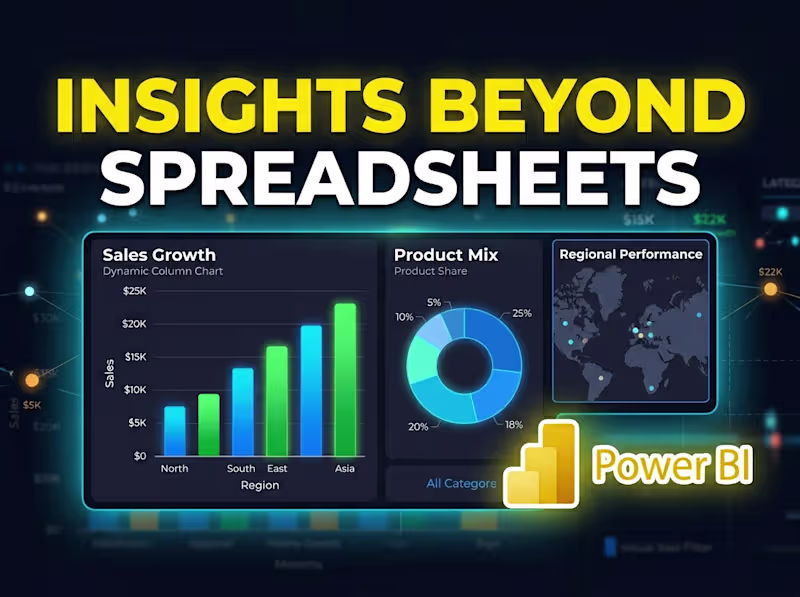
✔ Custom Excel Dashboards with dynamic charts & slicers
✔ KPI Tracker Reports (weekly, monthly, quarterly)
✔ Sales, Finance, HR & Operations Reports
✔ Pivot Tables & Pivot Charts — fully automated
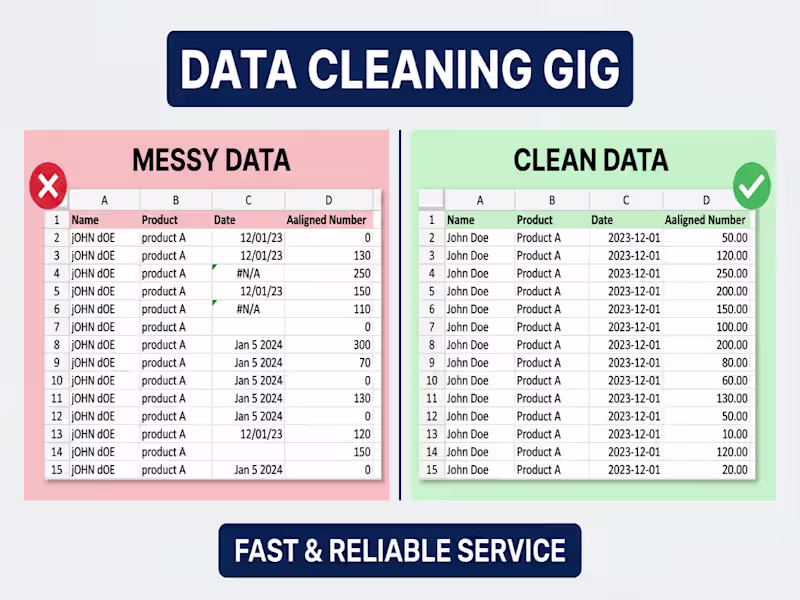
✔ Clean data formatting & structuring
✔ Print-ready & presentation-ready layouts
✔ One round of free revisions included
━━━━━━━━━━━━━━━━━━━━━━
🔷 WHO THIS IS PERFECT FOR
━━━━━━━━━━━━━━━━━━━━━━
→ Business owners who want a clear view of their numbers
→ Managers & team leads who report to stakeholders
→ Freelancers & agencies managing client data
→ E-commerce stores tracking orders, revenue & returns
→ HR teams monitoring headcount, attendance & payroll
→ Students & analysts presenting data projects
━━━━━━━━━━━━━━━━━━━━━━
🔷 MY PROCESS
━━━━━━━━━━━━━━━━━━━━━━
1️⃣ You share your raw data & requirements
2️⃣ I plan the layout and confirm the structure with you
3️⃣ I build your dashboard with charts, formulas & automation
4️⃣ Deliver clean, fully functional file — ready to use
━━━━━━━━━━━━━━━━━━━━━━
🔷 TOOLS I USE
━━━━━━━━━━━━━━━━━━━━━━
Microsoft Excel | Pivot Tables | Power Query | Advanced Formulas
VLOOKUP / XLOOKUP | Conditional Formatting | Dynamic Arrays
FAQs
Contact for pricing
Duration1 week
Tags
Business Intelligence
Data Visualizer
Business Reports
Excel Automation
Excel Dashboards
excel expert
Interactive Charts
KPI Dashboard
Reporting Solutions
Service provided by
Manigandan Acharya Mumbai, India
Excel Reports & Interactive Dashboards That Tells Data StoryManigandan Acharya
Contact for pricing
Duration1 week
Tags
Business Intelligence
Data Visualizer
Business Reports
Excel Automation
Excel Dashboards
excel expert
Interactive Charts
KPI Dashboard
Reporting Solutions
Tired of staring at endless rows of raw data with no clear insight? I turn your messy spreadsheets into clean, interactive Excel dashboards and reports that actually make decisions easier.
Whether you're a startup tracking growth metrics, an e-commerce brand monitoring sales performance, or a manager presenting to stakeholders — I design dashboards that are visual, intuitive, and built to impress.
━━━━━━━━━━━━━━━━━━━━━━
🔷 WHAT YOU GET
━━━━━━━━━━━━━━━━━━━━━━
✔ Custom Excel Dashboards with dynamic charts & slicers
✔ KPI Tracker Reports (weekly, monthly, quarterly)
✔ Sales, Finance, HR & Operations Reports
✔ Pivot Tables & Pivot Charts — fully automated
✔ Clean data formatting & structuring
✔ Print-ready & presentation-ready layouts
✔ One round of free revisions included
━━━━━━━━━━━━━━━━━━━━━━
🔷 WHO THIS IS PERFECT FOR
━━━━━━━━━━━━━━━━━━━━━━
→ Business owners who want a clear view of their numbers
→ Managers & team leads who report to stakeholders
→ Freelancers & agencies managing client data
→ E-commerce stores tracking orders, revenue & returns
→ HR teams monitoring headcount, attendance & payroll
→ Students & analysts presenting data projects
━━━━━━━━━━━━━━━━━━━━━━
🔷 MY PROCESS
━━━━━━━━━━━━━━━━━━━━━━
1️⃣ You share your raw data & requirements
2️⃣ I plan the layout and confirm the structure with you
3️⃣ I build your dashboard with charts, formulas & automation
4️⃣ Deliver clean, fully functional file — ready to use
━━━━━━━━━━━━━━━━━━━━━━
🔷 TOOLS I USE
━━━━━━━━━━━━━━━━━━━━━━
Microsoft Excel | Pivot Tables | Power Query | Advanced Formulas
VLOOKUP / XLOOKUP | Conditional Formatting | Dynamic Arrays
FAQs
Contact for pricing