
Claude Dashboard DesignSarah Lina Lachheb
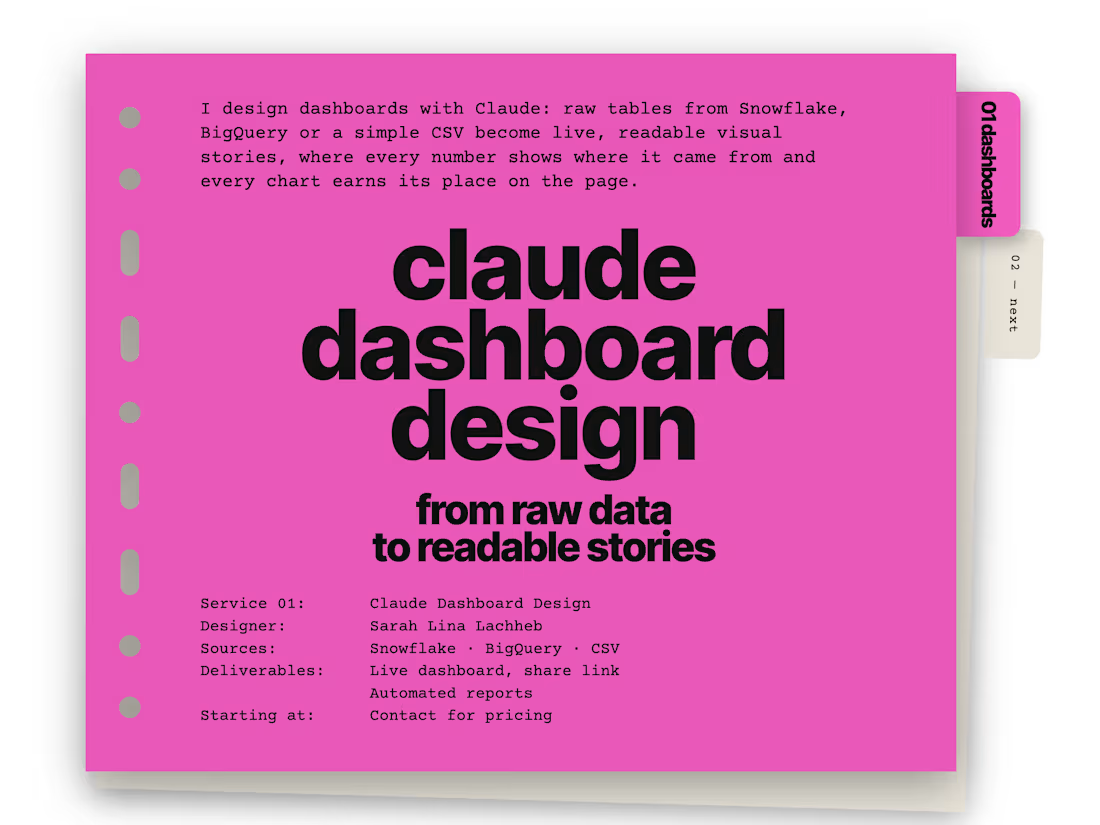
From raw data to a dashboard people actually want to read.
Have raw data but no clear way to turn it into a compelling dashboard?
I’ll transform your data into a custom, insight-driven dashboard designed to make complex information easy to explore, understand and communicate.
I use Claude to accelerate the design process, but the deliverable is not a generic AI-generated dashboard. I design the visual hierarchy, analytical structure, storytelling, chart selection and overall experience around your data.
What I can build
Executive & management dashboards
Business & KPI dashboards
Marketing & customer analytics
Product & user analytics
Operational dashboards
Data storytelling & editorial reports
Exploratory / portfolio dashboards
Industry-specific data visualizations
What you can provide
I can work from:
CSV / Excel files
Snowflake data
BigQuery data
SQL query outputs
Existing datasets
Raw tables or structured data
You don't need to have the dashboard structure figured out beforehand. I can help turn the raw data into the right analytical story.
My approach
01 — Understand the data
I explore the available dimensions, metrics and relationships to identify what is actually worth visualizing.
02 — Build the analytical story
Instead of filling a page with charts, I define the key questions the dashboard should answer and organize the information around them.
03 — Design the visual system
I select the appropriate visualizations, hierarchy, annotations, scales and composition for each insight.
04 — Build the dashboard
I turn the concept into a polished, interactive dashboard with a strong visual identity and clear navigation.
05 — Refine & deliver
I review readability, consistency and analytical clarity, then deliver the final dashboard and supporting files.
What you receive
A fully designed custom dashboard
Clear KPI hierarchy
Data-driven visualizations
Insight-focused layout
Responsive / presentation-ready design
Source and metric traceability
A polished visual system adapted to your dataset
Shareable final dashboard
Why this is different
Most dashboards are designed around the available charts.
I design them around the story the data needs to tell.
The result is closer to an editorial data experience than a collection of KPI cards.
Contact for pricing
Duration1 week
Tags
Claude

Snowflake

Dashboard
Data Visualizer
Service provided by
Sarah Lina Lachheb proParis, France
- 1
- Followers
Claude Dashboard DesignSarah Lina Lachheb
Contact for pricing
Duration1 week
Tags
Claude
Snowflake
Dashboard
Data Visualizer
From raw data to a dashboard people actually want to read.
Have raw data but no clear way to turn it into a compelling dashboard?
I’ll transform your data into a custom, insight-driven dashboard designed to make complex information easy to explore, understand and communicate.
I use Claude to accelerate the design process, but the deliverable is not a generic AI-generated dashboard. I design the visual hierarchy, analytical structure, storytelling, chart selection and overall experience around your data.
What I can build
Executive & management dashboards
Business & KPI dashboards
Marketing & customer analytics
Product & user analytics
Operational dashboards
Data storytelling & editorial reports
Exploratory / portfolio dashboards
Industry-specific data visualizations
What you can provide
I can work from:
CSV / Excel files
Snowflake data
BigQuery data
SQL query outputs
Existing datasets
Raw tables or structured data
You don't need to have the dashboard structure figured out beforehand. I can help turn the raw data into the right analytical story.
My approach
01 — Understand the data
I explore the available dimensions, metrics and relationships to identify what is actually worth visualizing.
02 — Build the analytical story
Instead of filling a page with charts, I define the key questions the dashboard should answer and organize the information around them.
03 — Design the visual system
I select the appropriate visualizations, hierarchy, annotations, scales and composition for each insight.
04 — Build the dashboard
I turn the concept into a polished, interactive dashboard with a strong visual identity and clear navigation.
05 — Refine & deliver
I review readability, consistency and analytical clarity, then deliver the final dashboard and supporting files.
What you receive
A fully designed custom dashboard
Clear KPI hierarchy
Data-driven visualizations
Insight-focused layout
Responsive / presentation-ready design
Source and metric traceability
A polished visual system adapted to your dataset
Shareable final dashboard
Why this is different
Most dashboards are designed around the available charts.
I design them around the story the data needs to tell.
The result is closer to an editorial data experience than a collection of KPI cards.
Contact for pricing