
I can create aggregations and visualizations of your data.Aaron Olson
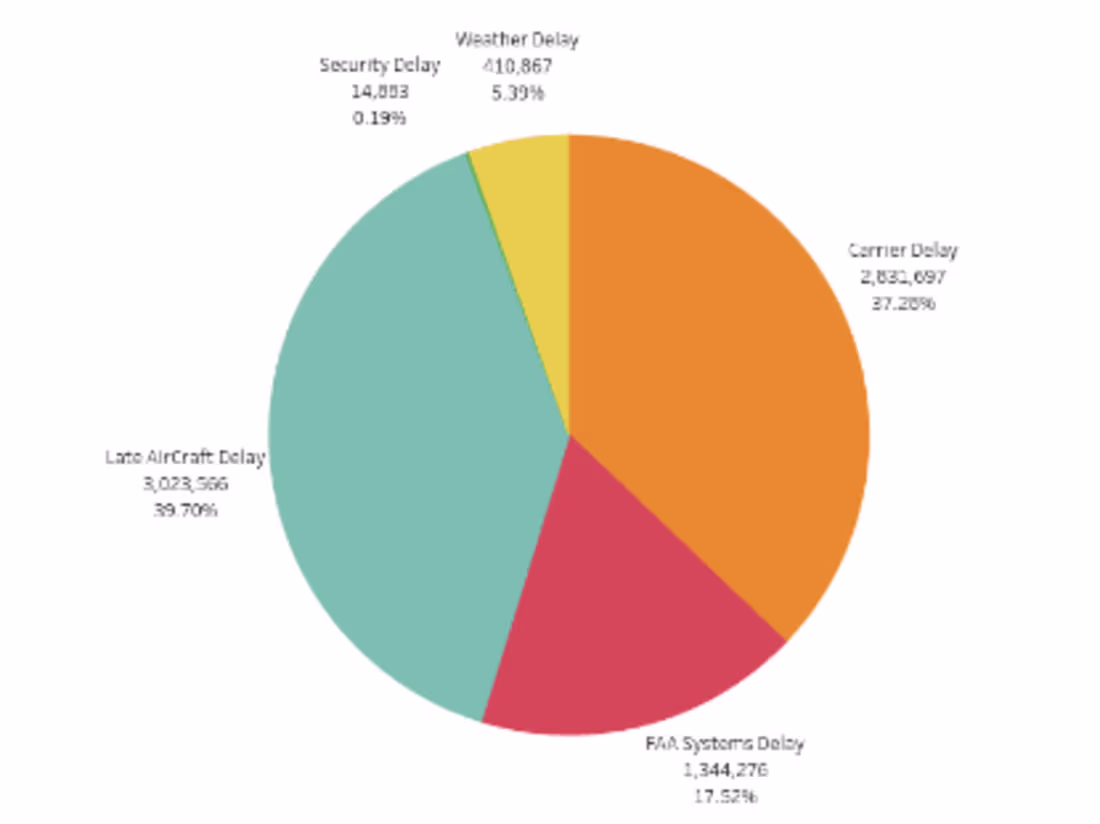
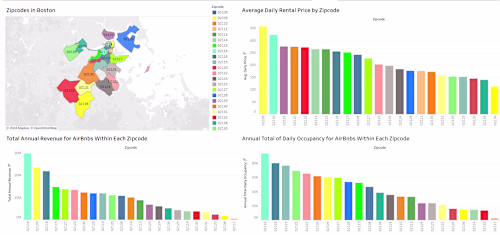
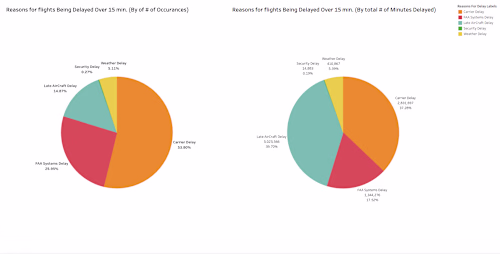
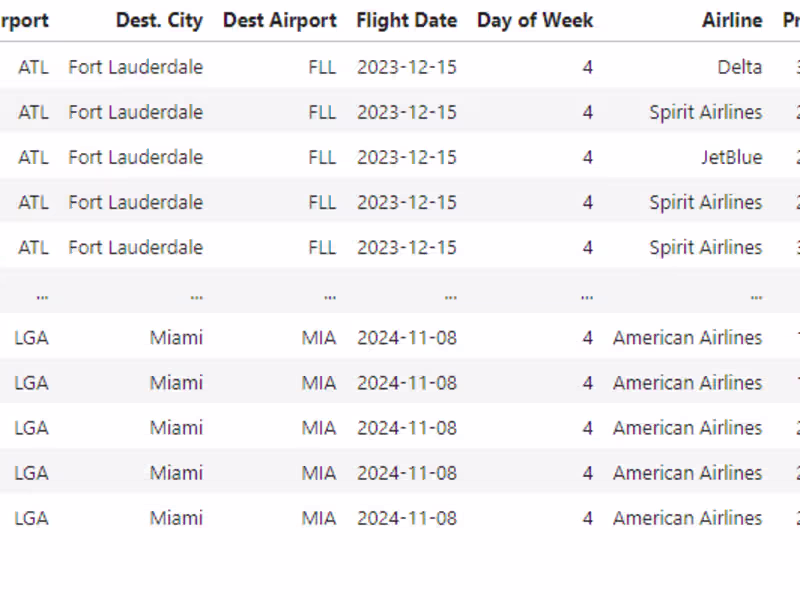
I can create a wide array of visualizations including line/bar graphs, pie charts, and tables. I can also parse information by running aggregations to help identify business trends and patterns.
What's included
Visulazations
I'll turn your raw dataset (csv or excel file) into visually appealing charts, graphs, and dashboards. These can guide you in making data driven decisions for your business.
Aggregations
Aggregation are mathmatical operations that can help you understand your data.
Some Examples include:
Finding the mean (average) salary for your employees in each department.
Find the total (sum) money spent on employee salaries.
Calculating the total number (count) of employees who make over $50,000 a year.
Find the employee with the maximum and minimum salary.
Aaron's other services
Starting at$25
Duration1 week
Tags
Google Sheets
Microsoft Excel
MySQL
pandas
Tableau
Data Analyst
Data Modelling Analyst
Data Scientist
Service provided by
Aaron Olson Montgomery, USA
I can create aggregations and visualizations of your data.Aaron Olson
Starting at$25
Duration1 week
Tags
Google Sheets
Microsoft Excel
MySQL
pandas
Tableau
Data Analyst
Data Modelling Analyst
Data Scientist
I can create a wide array of visualizations including line/bar graphs, pie charts, and tables. I can also parse information by running aggregations to help identify business trends and patterns.
What's included
Visulazations
I'll turn your raw dataset (csv or excel file) into visually appealing charts, graphs, and dashboards. These can guide you in making data driven decisions for your business.
Aggregations
Aggregation are mathmatical operations that can help you understand your data.
Some Examples include:
Finding the mean (average) salary for your employees in each department.
Find the total (sum) money spent on employee salaries.
Calculating the total number (count) of employees who make over $50,000 a year.
Find the employee with the maximum and minimum salary.
Aaron's other services
$25