
Data Visualization Create Dynamic Reports and VisualsKonstantinos Seretis
Transform your data into beautiful visuals. Creating visualisation that could help you better understand your data and how your company is working. I need no previous knewledge or anything by you. Just your business needs and the data. I can complete the visualisation in a short period and I will create them by your needs.
What's included
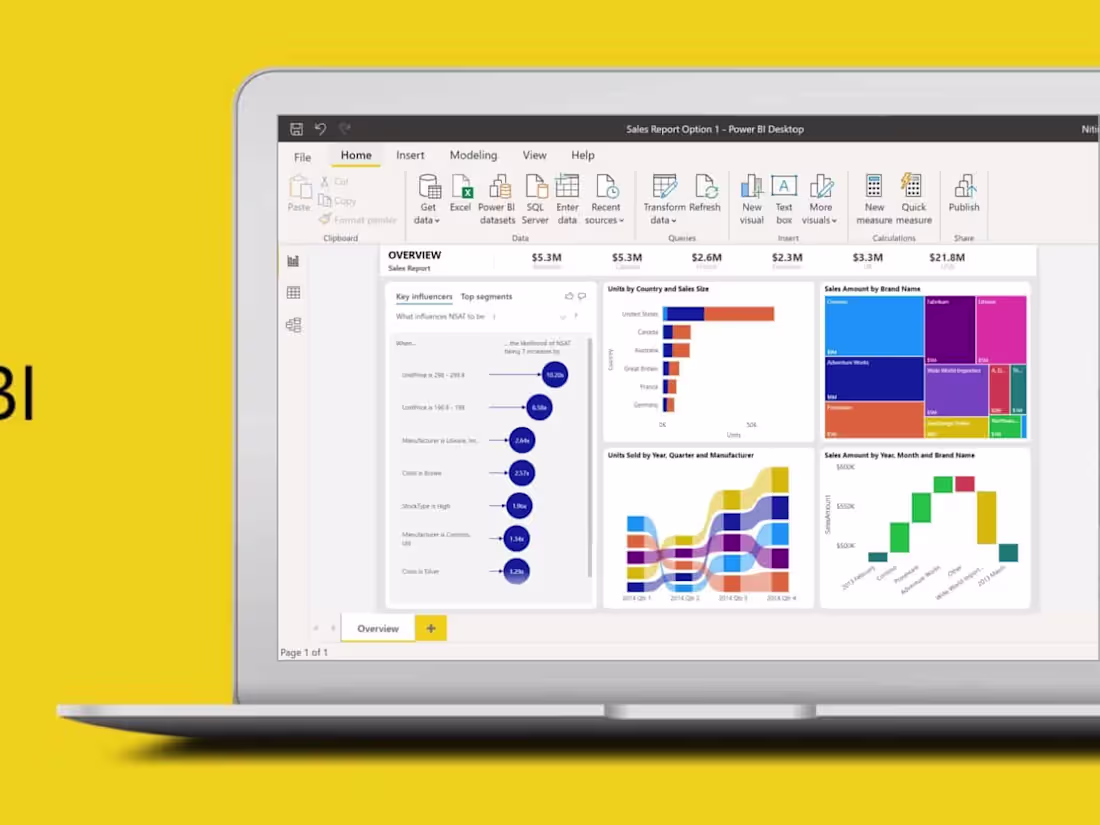
Dynamic Power BI (or Excel) Dashboard
This file will contain a dynamic Power BI dashboard with up to 4 tabs. The number of tabs are depending the customer needs. Dynamic means that by clicking on the report you can apply filters and the graphs will change. If the customer prefers excel then the dashboards would be on excel.
Dashboard Manual
A word file that would contain basic manual instructions so the customer could make future changes.
Konstantinos's other services

Starting at$10 /hr
Tags
Matplotlib
Microsoft Excel
Microsoft Power BI
Tableau
TensorFlow
Data Analyst
Data Scientist
Data Visualizer
Service provided by
Konstantinos Seretis Athens, Greece
Data Visualization Create Dynamic Reports and VisualsKonstantinos Seretis
Starting at$10 /hr
Tags
Matplotlib
Microsoft Excel
Microsoft Power BI
Tableau
TensorFlow
Data Analyst
Data Scientist
Data Visualizer
Transform your data into beautiful visuals. Creating visualisation that could help you better understand your data and how your company is working. I need no previous knewledge or anything by you. Just your business needs and the data. I can complete the visualisation in a short period and I will create them by your needs.
What's included
Dynamic Power BI (or Excel) Dashboard
This file will contain a dynamic Power BI dashboard with up to 4 tabs. The number of tabs are depending the customer needs. Dynamic means that by clicking on the report you can apply filters and the graphs will change. If the customer prefers excel then the dashboards would be on excel.
Dashboard Manual
A word file that would contain basic manual instructions so the customer could make future changes.
Konstantinos's other services
$10 /hr