
ML End-to-End Project in Python SATYAPRAKASH SETHY
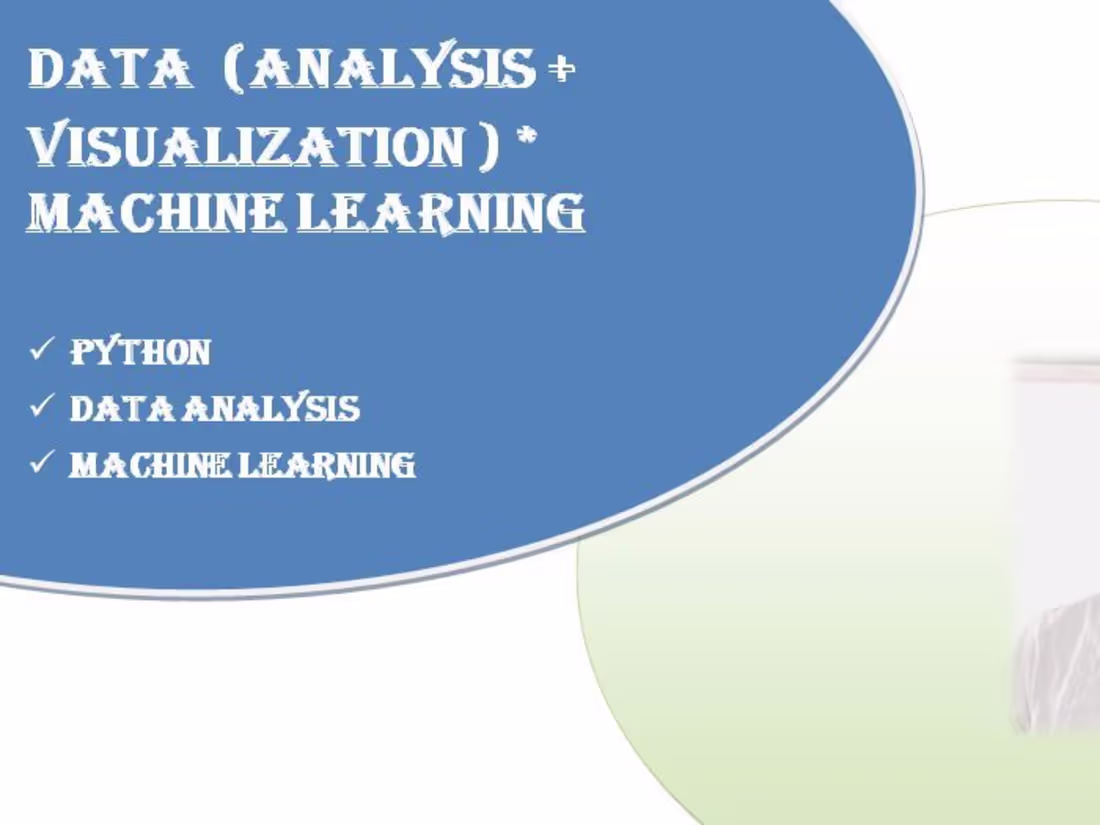
I offer expert data analysis services using Python, Excel, and Tableau to uncover actionable insights from your data. With extensive experience in exploratory data analysis, data cleaning, and building predictive models, I ensure high-quality, data-driven solutions tailored to your needs. My focus on delivering clear, impactful visualizations sets me apart.
What's included
Comprehensive Data Analysis Report
A detailed report with insights derived from the data, including statistical summaries, trends, and actionable recommendations.
Interactive Dashboards
Custom-built Tableau or Excel dashboards to visualize key metrics and trends, allowing for easy data-driven decision-making.
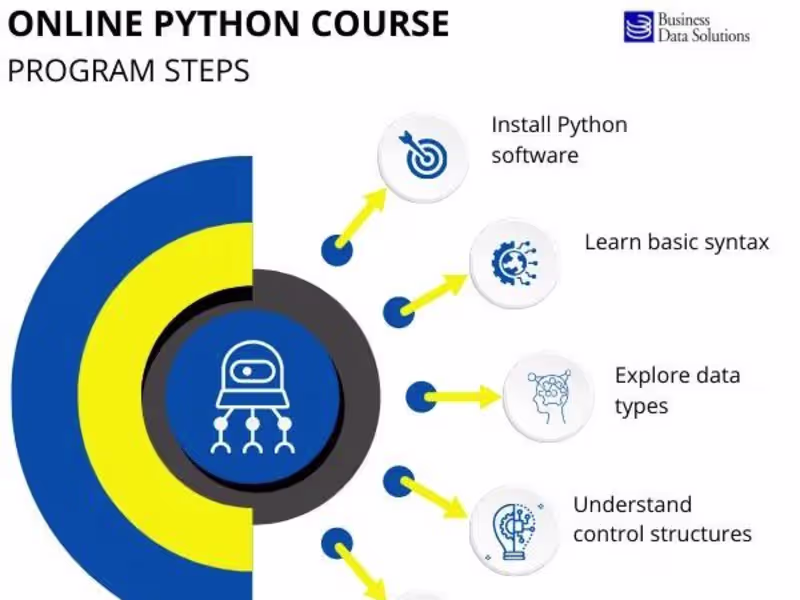
Data Cleaning and Preprocessing
Cleaned and structured data ready for analysis, including handling missing values, outliers, and ensuring data consistency.
Data Visualizations
High-quality visualizations (charts, graphs, etc.) to clearly present key findings from the data analysis.
SATYAPRAKASH's other services
Contact for pricing
Tags
Jupyter
Microsoft Excel
pandas
scikit-learn
Data Analyst
Data Modelling Analyst
Data Scientist
Service provided by
SATYAPRAKASH SETHY India
ML End-to-End Project in Python SATYAPRAKASH SETHY
Contact for pricing
Tags
Jupyter
Microsoft Excel
pandas
scikit-learn
Data Analyst
Data Modelling Analyst
Data Scientist
I offer expert data analysis services using Python, Excel, and Tableau to uncover actionable insights from your data. With extensive experience in exploratory data analysis, data cleaning, and building predictive models, I ensure high-quality, data-driven solutions tailored to your needs. My focus on delivering clear, impactful visualizations sets me apart.
What's included
Comprehensive Data Analysis Report
A detailed report with insights derived from the data, including statistical summaries, trends, and actionable recommendations.
Interactive Dashboards
Custom-built Tableau or Excel dashboards to visualize key metrics and trends, allowing for easy data-driven decision-making.
Data Cleaning and Preprocessing
Cleaned and structured data ready for analysis, including handling missing values, outliers, and ensuring data consistency.
Data Visualizations
High-quality visualizations (charts, graphs, etc.) to clearly present key findings from the data analysis.
SATYAPRAKASH's other services
Contact for pricing