
Excel Interactive Dashboard SolutionsJelilat Oluwatosin Abdullateef
Hello,
Are you looking to transform your data into dynamic, interactive dashboards that provide actionable insights? Look no further!
With over three years of experience in data analysis and visualization, I understand the power of interactive dashboards in driving strategic decisions. My expertise in Excel allows me to craft dashboards that not only present your data effectively but also enhance your decision-making processes.
Services I Offer:
- Custom Interactive Dashboard Design
- Data Visualization and Reporting
- Advanced Excel Formulas and Functions
- Interactive Charts and Graphs
- KPI Tracking and Metrics Visualization
- Data Filtering and Segmentation
- Dashboard Integration with Other Data Sources
- Dynamic Data Refresh and Updates
- User-Friendly Interface Design
- Performance Metrics Analysis
- Customizable Report Templates
Why Choose Me:
- Expertise in Excel: Proficient in creating sophisticated, interactive dashboards tailored to your needs.
- Insightful Visualizations: Crafting dashboards that turn complex data into clear, actionable insights.
- Custom Solutions: Personalized dashboards designed to meet your specific business requirements.
- Efficient Data Integration: Seamless integration of data from various sources into a unified dashboard.
- Commitment to Quality: Delivering high-quality, error-free dashboards that drive business success.
Contact me today to discuss your interactive dashboard needs and let’s start creating a powerful tool to visualize and analyze your data.
What's included
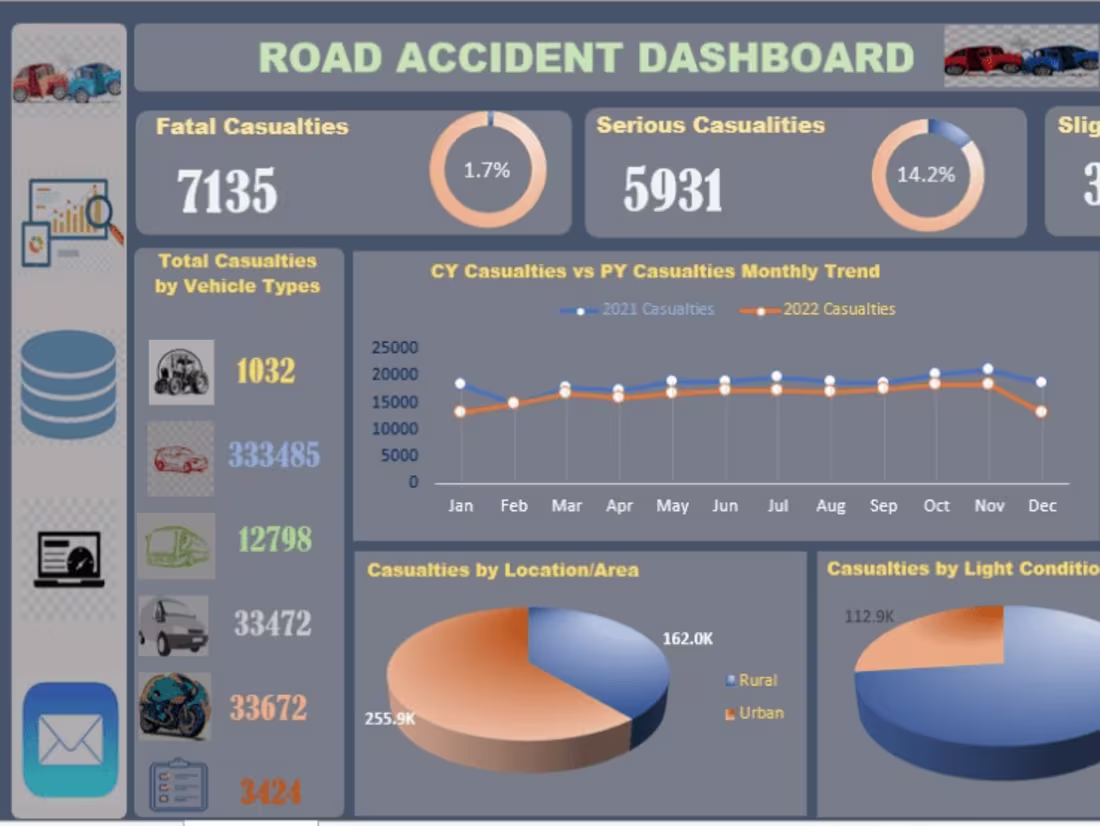
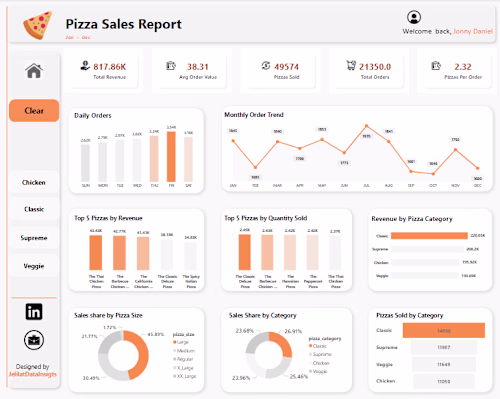
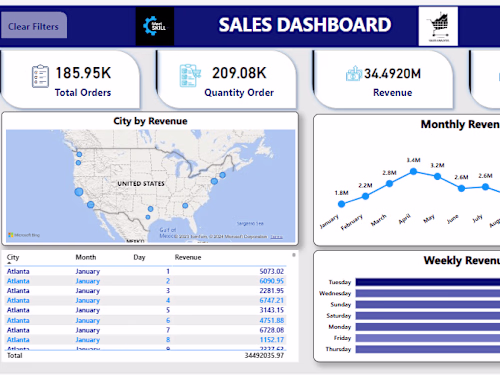
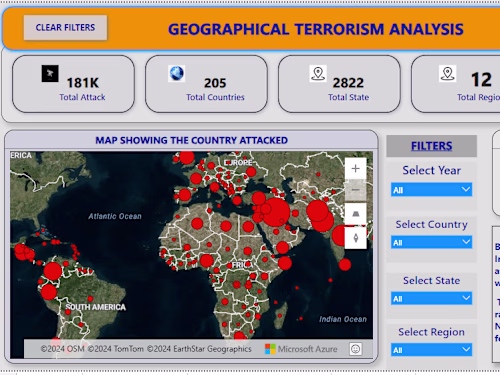
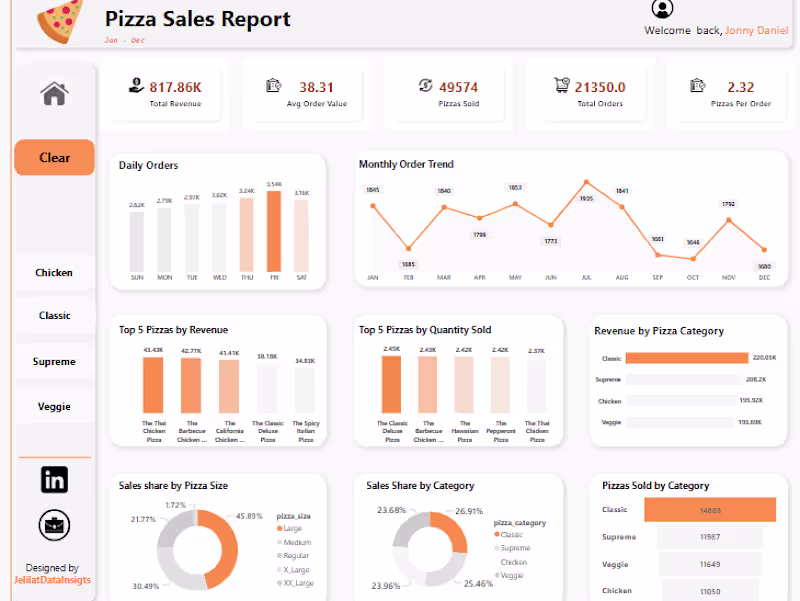
Interactive Dashboards
Custom-designed dashboards with interactive elements like slicers, pivot tables, and charts for easy data exploration.
Visualizations
A variety of visualization types, including bar charts, line graphs, scatter plots, and more.
Dashboard Documentation
Comprehensive documentation outlining the structure and functionality of the dashboard.
Data Workbook
The Excel file containing all visualizations and data.
FAQs
Jelilat Oluwatosin's other services
Starting at$10 /hr
Tags
Excel VBA
Google Sheets
Microsoft Excel
Microsoft Office 365
Business Analyst
Data Analyst
Data Visualizer
Service provided by
Jelilat Oluwatosin Abdullateef Nigeria
- 17
- Followers
Excel Interactive Dashboard SolutionsJelilat Oluwatosin Abdullateef
Starting at$10 /hr
Tags
Excel VBA
Google Sheets
Microsoft Excel
Microsoft Office 365
Business Analyst
Data Analyst
Data Visualizer
Hello,
Are you looking to transform your data into dynamic, interactive dashboards that provide actionable insights? Look no further!
With over three years of experience in data analysis and visualization, I understand the power of interactive dashboards in driving strategic decisions. My expertise in Excel allows me to craft dashboards that not only present your data effectively but also enhance your decision-making processes.
Services I Offer:
- Custom Interactive Dashboard Design
- Data Visualization and Reporting
- Advanced Excel Formulas and Functions
- Interactive Charts and Graphs
- KPI Tracking and Metrics Visualization
- Data Filtering and Segmentation
- Dashboard Integration with Other Data Sources
- Dynamic Data Refresh and Updates
- User-Friendly Interface Design
- Performance Metrics Analysis
- Customizable Report Templates
Why Choose Me:
- Expertise in Excel: Proficient in creating sophisticated, interactive dashboards tailored to your needs.
- Insightful Visualizations: Crafting dashboards that turn complex data into clear, actionable insights.
- Custom Solutions: Personalized dashboards designed to meet your specific business requirements.
- Efficient Data Integration: Seamless integration of data from various sources into a unified dashboard.
- Commitment to Quality: Delivering high-quality, error-free dashboards that drive business success.
Contact me today to discuss your interactive dashboard needs and let’s start creating a powerful tool to visualize and analyze your data.
What's included
Interactive Dashboards
Custom-designed dashboards with interactive elements like slicers, pivot tables, and charts for easy data exploration.
Visualizations
A variety of visualization types, including bar charts, line graphs, scatter plots, and more.
Dashboard Documentation
Comprehensive documentation outlining the structure and functionality of the dashboard.
Data Workbook
The Excel file containing all visualizations and data.
FAQs
Jelilat Oluwatosin's other services
$10 /hr