
Business Data Analysis & Insights DashboardSubhasya Santhoshi
I help businesses uncover opportunities, solve inefficiencies, and make smarter decisions through clear, data-driven insights. With my blend of data science and business analysis, I translate raw data into dashboards and strategies that drive real results, across any industry.
What's included
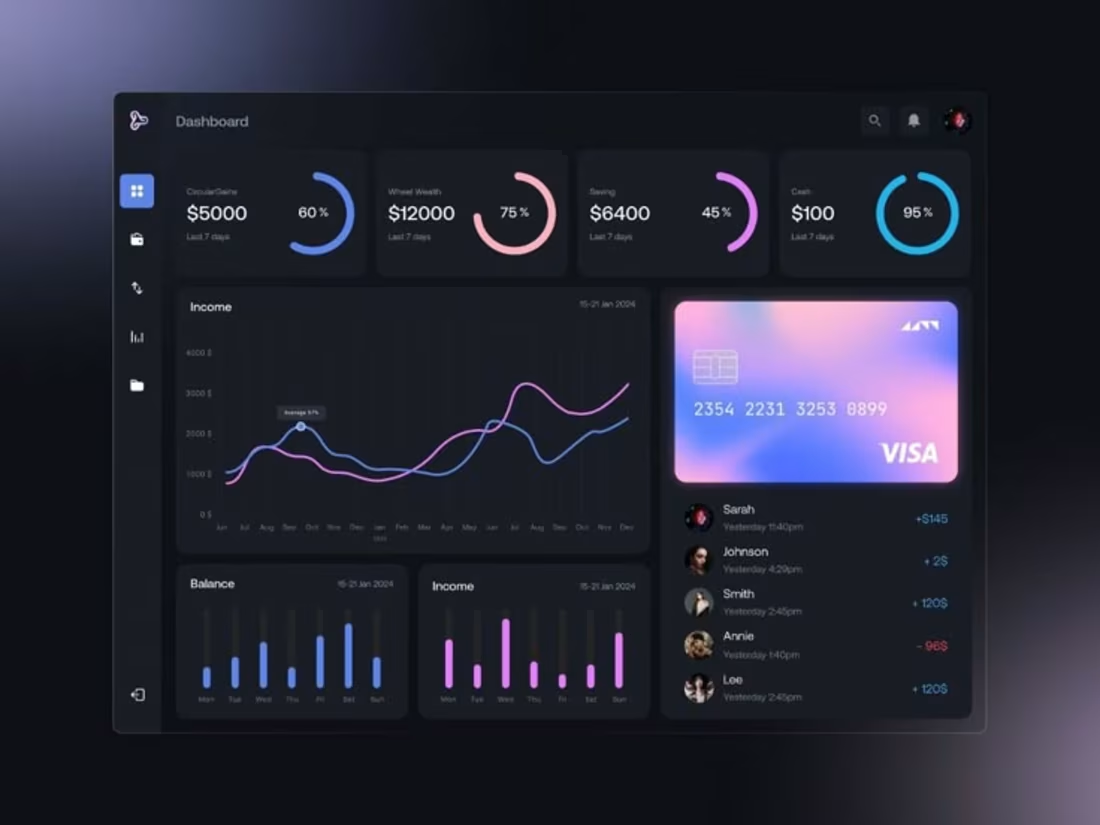
Need clarity on your numbers? I analyze your business, user, or operations data to uncover patterns, trends, and risks that aren't obvious at first glance. Whether you're in e-commerce, SaaS, healthcare, or education—I’ll turn your raw data into actionable dashboards using Python, Excel, or Tableau. From sales and performance metrics to customer behavior or operational bottlenecks, you’ll receive not just visuals, but clear takeaways that align with your business goals.
🔹 Cleaned & Transformed Dataset – prepared for immediate analysis or reuse
🔹 Interactive Dashboard – delivered in Excel, Tableau, or Python (Streamlit)
🔹 Executive Insights Report – PDF/Slides with strategic recommendations
🔹 Custom KPIs – visualized based on your goals (sales, churn, inventory, etc.)
🔹 One Feedback Round Included – fine-tuning after initial delivery
Contact for pricing
Tags
Microsoft Excel
Microsoft Power BI
Python
SQL
Tableau
Business Analyst
Data Analyst
Data Visualizer
Service provided by
Subhasya Santhoshi Bengaluru, India
Business Data Analysis & Insights DashboardSubhasya Santhoshi
Contact for pricing
Tags
Microsoft Excel
Microsoft Power BI
Python
SQL
Tableau
Business Analyst
Data Analyst
Data Visualizer
I help businesses uncover opportunities, solve inefficiencies, and make smarter decisions through clear, data-driven insights. With my blend of data science and business analysis, I translate raw data into dashboards and strategies that drive real results, across any industry.
What's included
Need clarity on your numbers? I analyze your business, user, or operations data to uncover patterns, trends, and risks that aren't obvious at first glance. Whether you're in e-commerce, SaaS, healthcare, or education—I’ll turn your raw data into actionable dashboards using Python, Excel, or Tableau. From sales and performance metrics to customer behavior or operational bottlenecks, you’ll receive not just visuals, but clear takeaways that align with your business goals.
🔹 Cleaned & Transformed Dataset – prepared for immediate analysis or reuse
🔹 Interactive Dashboard – delivered in Excel, Tableau, or Python (Streamlit)
🔹 Executive Insights Report – PDF/Slides with strategic recommendations
🔹 Custom KPIs – visualized based on your goals (sales, churn, inventory, etc.)
🔹 One Feedback Round Included – fine-tuning after initial delivery
Contact for pricing