
Data analysis and visualizationCinzia Bongino
As a Data Visualisation designer, my main task is to deliver information through visual models. Depending on the typology of data and audience, I can design bespoke interactive or static graphs, charts, maps, databases, and dashboards, respecting accessibility guidelines and best practices.
Services:
Research
Data cleansing and analysis
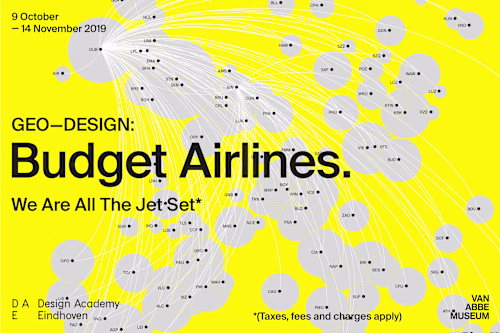
Mapping
Prototypes
Printed and digital reports
Scrollytelling
Tailored courses
What's included
Infographic
Visually compelling and information-dense graphic that conveys complex data or concepts in a clear manner. Static or interactive, enriched with bespoke visuals.
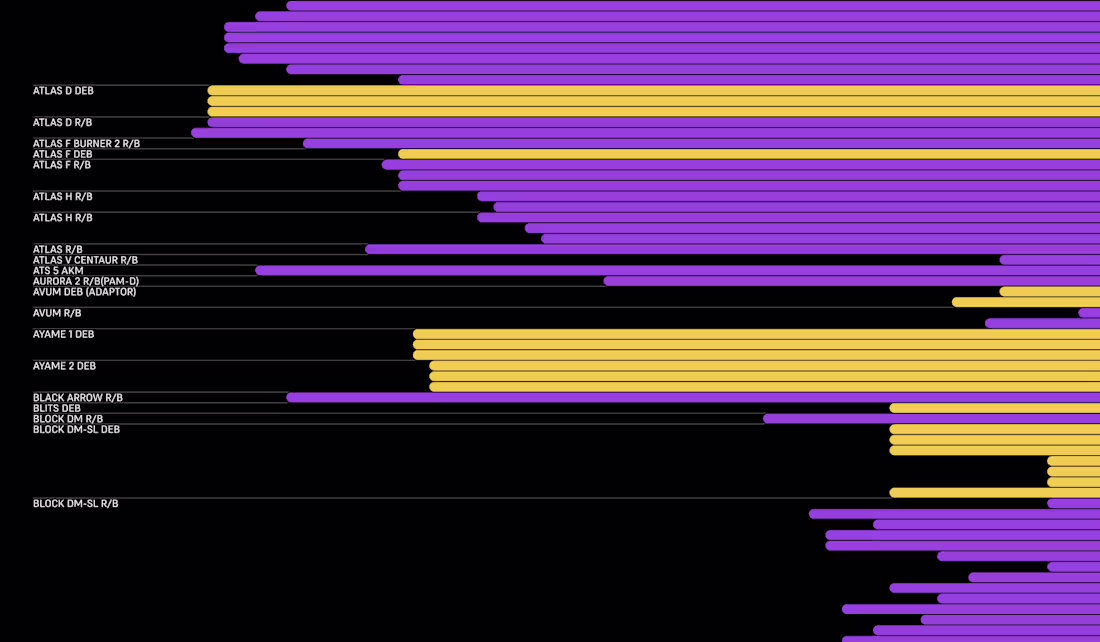
Charts and Maps
Static or interactive components to present your data.
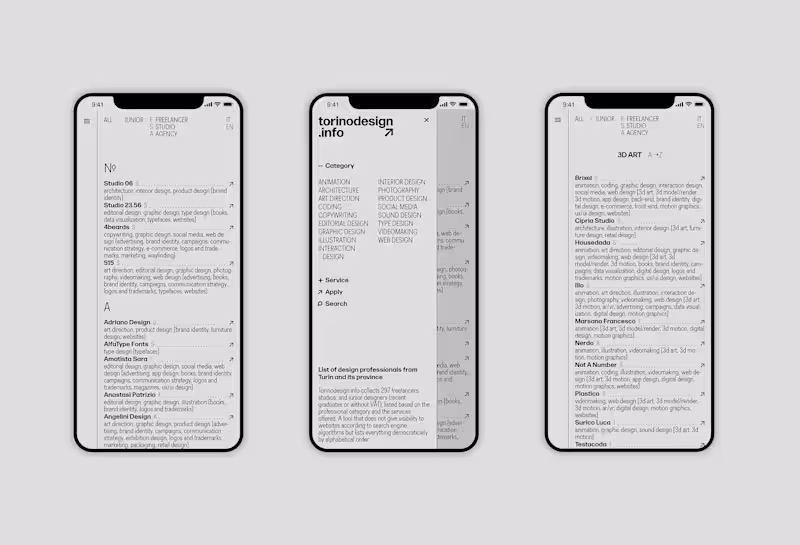
Dashboard (for mobile and desktop)
Visual interfaces displaying key information, metrics, and data points in an accessible format. I have already worked on dashboards related to weather, technology, and manufacturing process.
Website with data visualization
Web pages or digital reports enriched with interactive charts and maps.
Cinzia's other services

Contact for pricing
Tags
Adobe Illustrator
Figma
QGIS
Tableau
Data Analyst
Data Visualizer
Researcher
Service provided by
Cinzia Bongino Metropolitan City of Turin, Italy
- $1k+
- Earned
- 3
- Paid projects
- 5.00
- Rating
- 17
- Followers
Data analysis and visualizationCinzia Bongino
Contact for pricing
Tags
Adobe Illustrator
Figma
QGIS
Tableau
Data Analyst
Data Visualizer
Researcher
As a Data Visualisation designer, my main task is to deliver information through visual models. Depending on the typology of data and audience, I can design bespoke interactive or static graphs, charts, maps, databases, and dashboards, respecting accessibility guidelines and best practices.
Services:
Research
Data cleansing and analysis
Mapping
Prototypes
Printed and digital reports
Scrollytelling
Tailored courses
What's included
Infographic
Visually compelling and information-dense graphic that conveys complex data or concepts in a clear manner. Static or interactive, enriched with bespoke visuals.
Charts and Maps
Static or interactive components to present your data.
Dashboard (for mobile and desktop)
Visual interfaces displaying key information, metrics, and data points in an accessible format. I have already worked on dashboards related to weather, technology, and manufacturing process.
Website with data visualization
Web pages or digital reports enriched with interactive charts and maps.
Cinzia's other services
Contact for pricing