
Business Data Visualization DashboardsGabriel Leite
I build interactive data visualization dashboards that transform raw data into clear, actionable insights. My work combines solid software engineering with thoughtful design, resulting in responsive interfaces, intuitive charts, and deployment-ready solutions that help teams understand and act on their metrics faster.
What's included
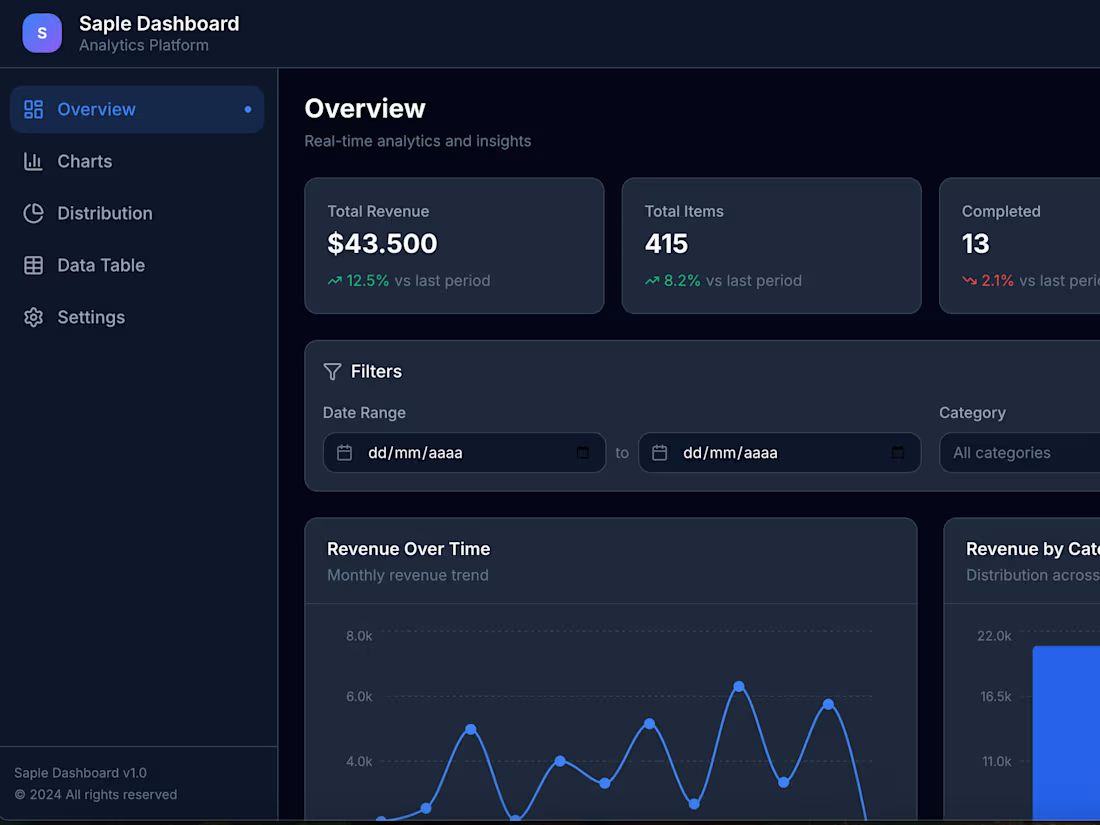
Live Interactive Dashboard
A fully functional dashboard with interactive charts, responsive layout, and clean UI for desktop and mobile.
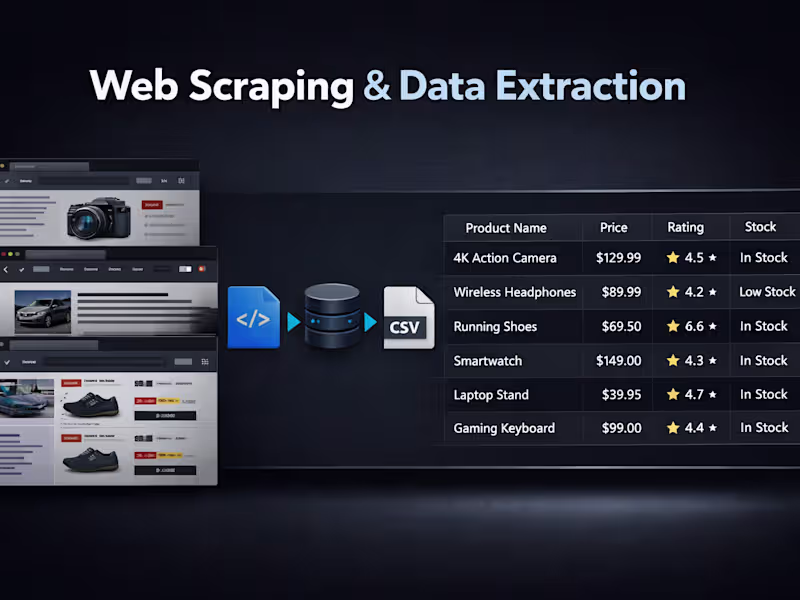
Data Integration Layer
A data layer capable of consuming data from CSV, JSON, or APIs, with transformations for visualization.
Visual Components
Reusable components including:
Line chart
Bar chart
Pie/donut chart
Data cards (KPIs)
Tables with sort/filter
Filters & Interactions
User interactions such as:
Category filtering
Date filtering
Hover tooltips
State transitions
Deployment-Ready Build
Ready for deployment on platforms like Vercel, Netlify, or AWS.
Source Code Repository
Well-structured codebase with clear components and documentation.
Technical Documentation
Documentation covering:
Data structure
How to extend the dashboard
How to update datasets
How to customize charts
How to deploy
Branding Customization
Optional customization for:
Colors
Typography
Labels
Icons
Gabriel's other services


Business Data Visualization DashboardsGabriel Leite
I build interactive data visualization dashboards that transform raw data into clear, actionable insights. My work combines solid software engineering with thoughtful design, resulting in responsive interfaces, intuitive charts, and deployment-ready solutions that help teams understand and act on their metrics faster.
What's included
Live Interactive Dashboard
A fully functional dashboard with interactive charts, responsive layout, and clean UI for desktop and mobile.
Data Integration Layer
A data layer capable of consuming data from CSV, JSON, or APIs, with transformations for visualization.
Visual Components
Reusable components including:
Line chart
Bar chart
Pie/donut chart
Data cards (KPIs)
Tables with sort/filter
Filters & Interactions
User interactions such as:
Category filtering
Date filtering
Hover tooltips
State transitions
Deployment-Ready Build
Ready for deployment on platforms like Vercel, Netlify, or AWS.
Source Code Repository
Well-structured codebase with clear components and documentation.
Technical Documentation
Documentation covering:
Data structure
How to extend the dashboard
How to update datasets
How to customize charts
How to deploy
Branding Customization
Optional customization for:
Colors
Typography
Labels
Icons
Gabriel's other services
$300