
Custom Interactive Data Dashboard (Python & Streamlit)Sujal Makwana

I will build a professional, interactive data dashboard tailored to your business needs using Python and Streamlit.
What’s Included:
Data Integration: Connecting your CSV, Excel, or SQL data.
Custom Visuals: Interactive charts (Plotly/Matplotlib) focused on your key KPIs.
User Filters: Dynamic sidebars to filter data by date, region, or category.
Deployment: A live link to your hosted dashboard (Streamlit Cloud).
Perfect for: Real Estate analytics, E-commerce sales tracking, or Logistics/Import-Export monitoring.
Standard delivery: 5-7 days.
NOT SURE HOW THIS WORK OR HOW MY SERVICES ALIGN WITH YOUR NEEDS? MASSAGE ME
FAQs
To begin, I'll need your dataset (Excel, CSV, or SQL access) and a brief list of the key insights or 'questions' you want the data to answer. If you have specific brand colors or a preferred layout, feel free to share those as well!
Yes! All dashboards are built using Streamlit, which is natively responsive. I will provide you with a live URL that you can access on any device or embed directly into your company’s internal portal.
Absolutely. As a B.Sc. AI & ML student at IIIT Vadodara, I follow strict data privacy ethics. I only use your data to build the tool, and I am happy to sign an NDA (Non-Disclosure Agreement) before we begin.
The dashboards I build are automated. This means once I set up the 'plumbing,' you can simply upload a new version of your data file, and the charts will update themselves instantly without needing more code
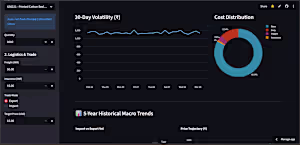
Example work

Starting at$500
Duration2 weeks
Tags
Python


Streamlit

Data Visualizer
Service provided by
Sujal Makwana Ahmedabad, India
Custom Interactive Data Dashboard (Python & Streamlit)Sujal Makwana
Starting at$500
Duration2 weeks
Tags
Python
Streamlit
Data Visualizer
I will build a professional, interactive data dashboard tailored to your business needs using Python and Streamlit.
What’s Included:
Data Integration: Connecting your CSV, Excel, or SQL data.
Custom Visuals: Interactive charts (Plotly/Matplotlib) focused on your key KPIs.
User Filters: Dynamic sidebars to filter data by date, region, or category.
Deployment: A live link to your hosted dashboard (Streamlit Cloud).
Perfect for: Real Estate analytics, E-commerce sales tracking, or Logistics/Import-Export monitoring.
Standard delivery: 5-7 days.
NOT SURE HOW THIS WORK OR HOW MY SERVICES ALIGN WITH YOUR NEEDS? MASSAGE ME
FAQs
To begin, I'll need your dataset (Excel, CSV, or SQL access) and a brief list of the key insights or 'questions' you want the data to answer. If you have specific brand colors or a preferred layout, feel free to share those as well!
Yes! All dashboards are built using Streamlit, which is natively responsive. I will provide you with a live URL that you can access on any device or embed directly into your company’s internal portal.
Absolutely. As a B.Sc. AI & ML student at IIIT Vadodara, I follow strict data privacy ethics. I only use your data to build the tool, and I am happy to sign an NDA (Non-Disclosure Agreement) before we begin.
The dashboards I build are automated. This means once I set up the 'plumbing,' you can simply upload a new version of your data file, and the charts will update themselves instantly without needing more code
Example work
$500