
Interactive Data Dashboard — R Shiny & StreamlitArditya Apusing
I'll build you a fully interactive, web-deployed dashboard from your data — with filters, charts, KPI cards, and real-time views your whole team can access from a browser link.
What you get:
→ Live deployed dashboard (R Shiny or Streamlit)
→ Interactive filters, charts, and summary metrics
→ Clean, professional design ready to share with stakeholders
→ Source code + 1 round of revisions
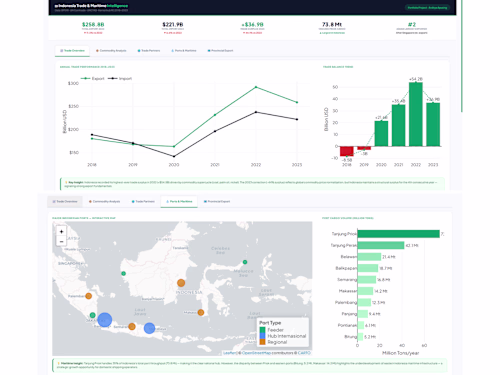
I've built dashboards tracking 800K+ transactions for a state-owned enterprise in Indonesia, and 5 live public dashboards you can preview in my portfolio right now.
Best for: businesses that want to stop sending static Excel reports and start making decisions from live, visual data.
FAQs
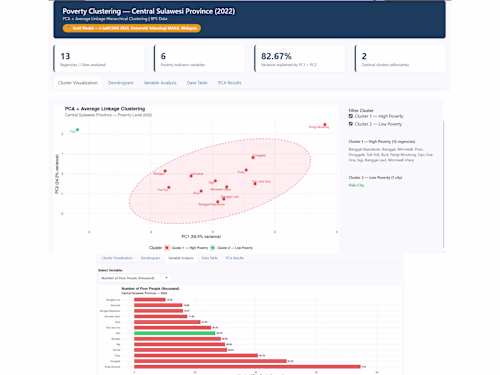
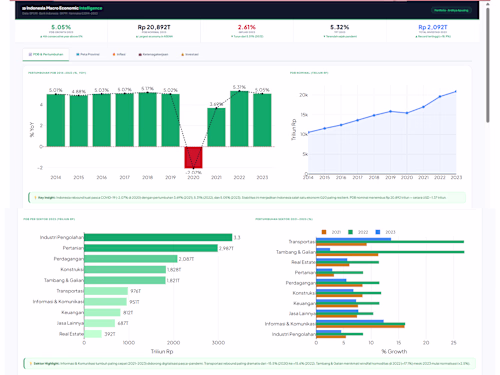
Example work
Arditya's other services
Starting at$100
Duration5 days
Tags
Python
R
Streamlit
Dashboard
Data Analyst
Data Visualizer
Web App
Bussiness Intelligence
R Shiny
Service provided by
Arditya Apusing Indonesia
Interactive Data Dashboard — R Shiny & StreamlitArditya Apusing
Starting at$100
Duration5 days
Tags
Python
R
Streamlit
Dashboard
Data Analyst
Data Visualizer
Web App
Bussiness Intelligence
R Shiny
I'll build you a fully interactive, web-deployed dashboard from your data — with filters, charts, KPI cards, and real-time views your whole team can access from a browser link.
What you get:
→ Live deployed dashboard (R Shiny or Streamlit)
→ Interactive filters, charts, and summary metrics
→ Clean, professional design ready to share with stakeholders
→ Source code + 1 round of revisions
I've built dashboards tracking 800K+ transactions for a state-owned enterprise in Indonesia, and 5 live public dashboards you can preview in my portfolio right now.
Best for: businesses that want to stop sending static Excel reports and start making decisions from live, visual data.
FAQs
Example work
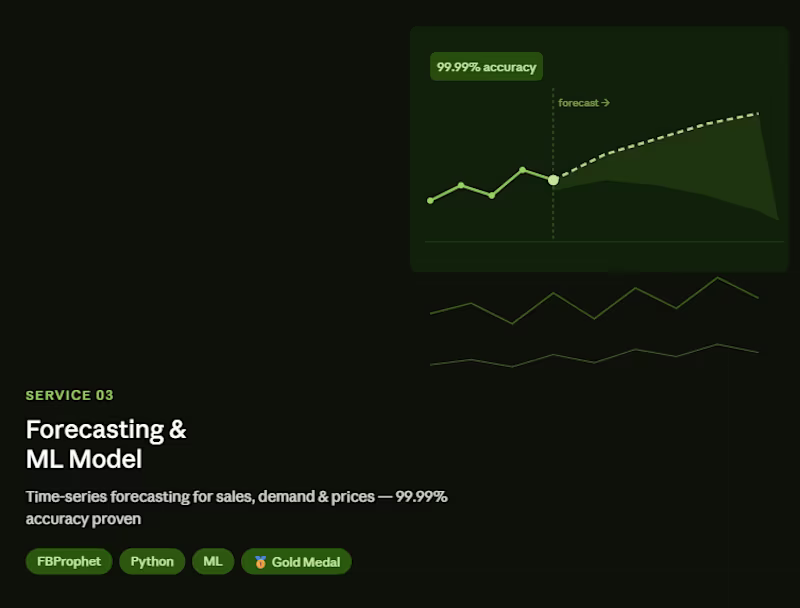
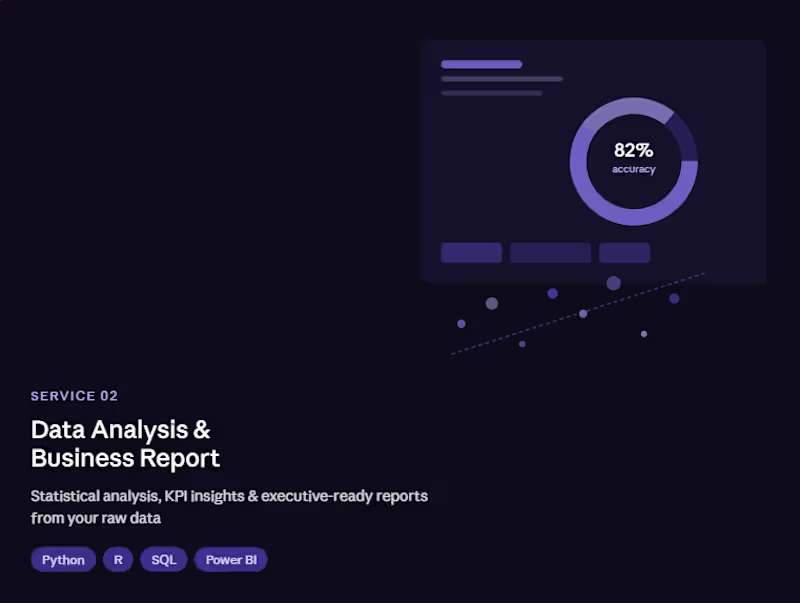
Arditya's other services
$100