
Excel SolutionVARSHA ZOKE
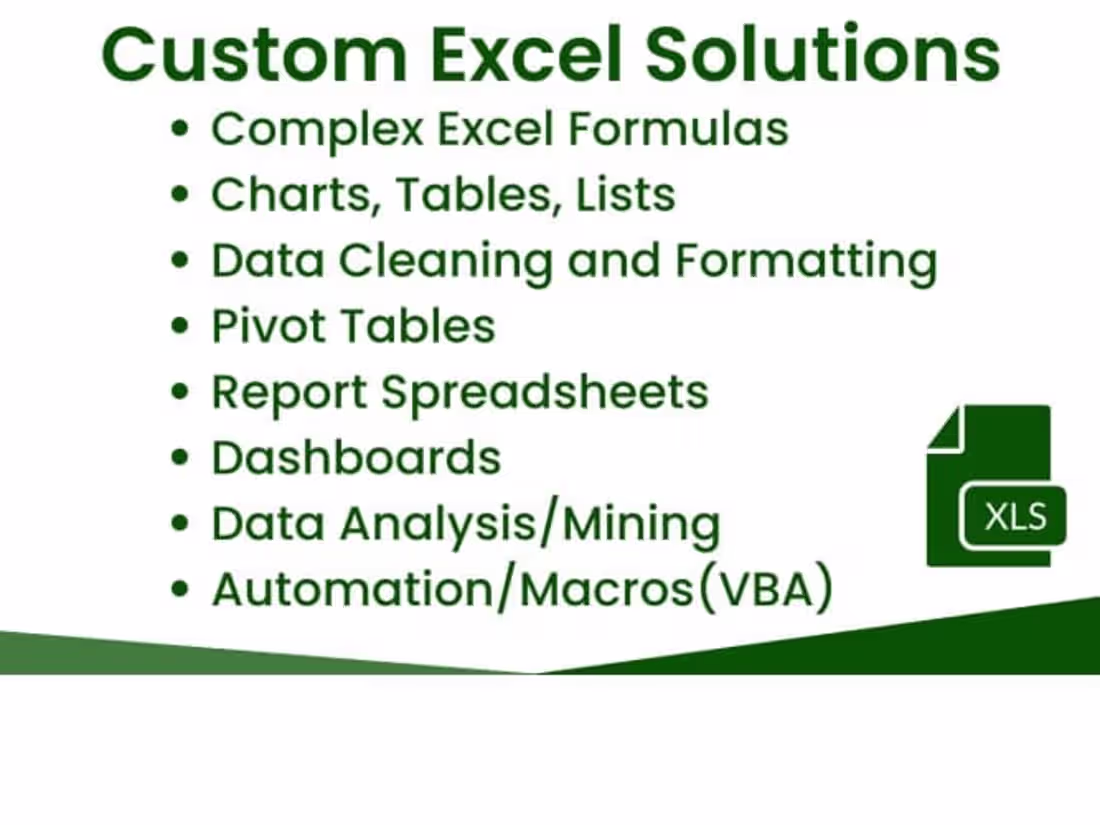
All Advanced Excel, Excel data analytics services.
What's included
A. Complex Excel Formulas:
will work on the complex formulas in Excel with use of variety of functions and order of operations
• Order of operations
• VLOOKUP
• SUMIF
• SUM
• XLOOKUP
B. Create tables and charts in Excel by:
• Creating a table
• Creating a chart
• Line graph
• Pie chart
• Area chart
• Doughnut chart
• Histogram
C. Data cleaning and formatting:
Data cleaning: Will remove or fix errors in data and ensure it's consistent.
• Remove duplicate data
• Remove irrelevant data
• Address outliers
• Data validation
Data formatting: Will make data more readable and consistent
• Clear formatting
• Conditional formatting
D. Pivot table:
Pivot tables are a powerful tool for summarizing, analyzing, and presenting data. They can automatically aggregate data and calculate sums, and can configure them to show percentages
• Check your data
• Select the correct data range
• Add a field
• Filter
E. Creating Dashboard:
A dashboard is a visual representation of key metrics that allow you to quickly view and analyze your data in one place.
• Get your data
• Create PivotTables
• Create Pivot Charts
• Formatting Chart
• Add Slicers and a Timeline
F. Data Analysis/Mining:
Data mining analysis is the process of using statistical analysis and machine learning to discover patterns, correlations, and anomalies in large dataset.
• Anomaly detection
• Association rule learning
• Clustering
• Outlier analysis
• Text mining
G. Automation/Macros(VBA)
Automation and macros in Visual Basic for Applications (VBA) can help you streamline your workflow and save time by automating repetitive tasks.
• Record a macro
• Create a user interface macro
• Create a data macro
• Automate report generation
• Consolidate reports
• Clean and transform data
• Automate email
• Automate document generation
VARSHA's other services
Contact for pricing
Tags
Microsoft Excel
Microsoft Power BI
Tableau
Data Analyst
Data Entry Specialist
Data Visualizer
Service provided by
VARSHA ZOKE Pune, India
- 1
- Followers
Excel SolutionVARSHA ZOKE
Contact for pricing
Tags
Microsoft Excel
Microsoft Power BI
Tableau
Data Analyst
Data Entry Specialist
Data Visualizer
All Advanced Excel, Excel data analytics services.
What's included
A. Complex Excel Formulas:
will work on the complex formulas in Excel with use of variety of functions and order of operations
• Order of operations
• VLOOKUP
• SUMIF
• SUM
• XLOOKUP
B. Create tables and charts in Excel by:
• Creating a table
• Creating a chart
• Line graph
• Pie chart
• Area chart
• Doughnut chart
• Histogram
C. Data cleaning and formatting:
Data cleaning: Will remove or fix errors in data and ensure it's consistent.
• Remove duplicate data
• Remove irrelevant data
• Address outliers
• Data validation
Data formatting: Will make data more readable and consistent
• Clear formatting
• Conditional formatting
D. Pivot table:
Pivot tables are a powerful tool for summarizing, analyzing, and presenting data. They can automatically aggregate data and calculate sums, and can configure them to show percentages
• Check your data
• Select the correct data range
• Add a field
• Filter
E. Creating Dashboard:
A dashboard is a visual representation of key metrics that allow you to quickly view and analyze your data in one place.
• Get your data
• Create PivotTables
• Create Pivot Charts
• Formatting Chart
• Add Slicers and a Timeline
F. Data Analysis/Mining:
Data mining analysis is the process of using statistical analysis and machine learning to discover patterns, correlations, and anomalies in large dataset.
• Anomaly detection
• Association rule learning
• Clustering
• Outlier analysis
• Text mining
G. Automation/Macros(VBA)
Automation and macros in Visual Basic for Applications (VBA) can help you streamline your workflow and save time by automating repetitive tasks.
• Record a macro
• Create a user interface macro
• Create a data macro
• Automate report generation
• Consolidate reports
• Clean and transform data
• Automate email
• Automate document generation
VARSHA's other services
Contact for pricing