
Retool Data Visualization DashboardSalman Maqbool
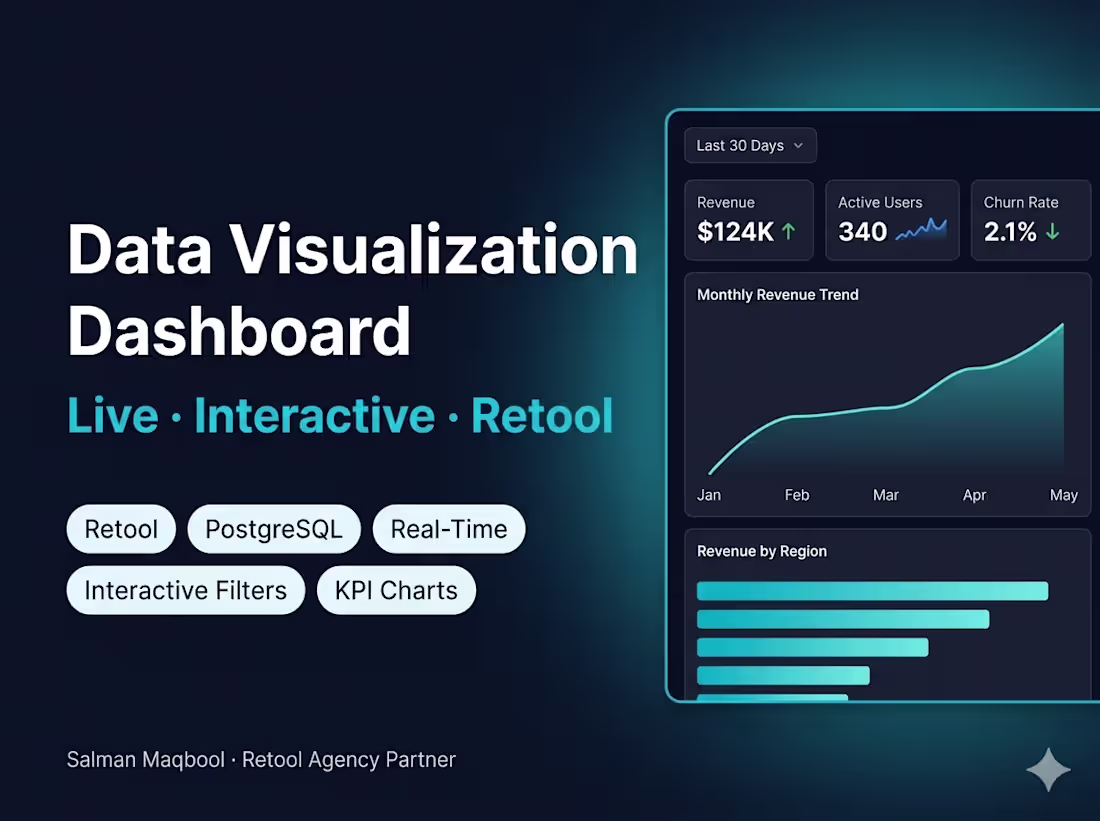
Your data is in PostgreSQL, Airtable, Google Sheets, or an API — but your team is making decisions from raw tables and messy exports. A proper data visualization dashboard turns that raw data into clear, interactive charts, KPI cards, and trend reports your leadership can actually use.
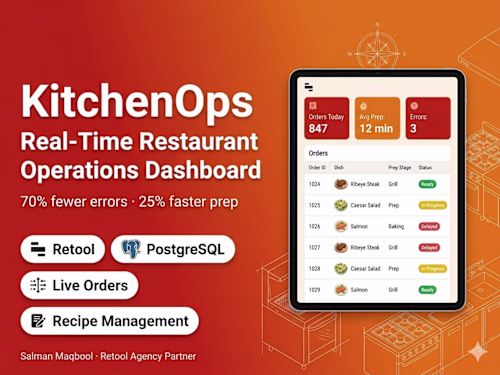
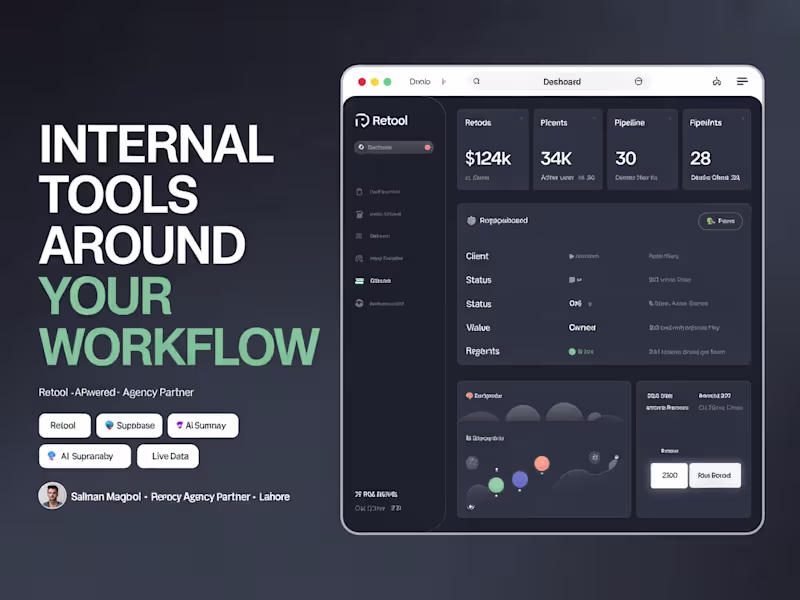
I build Retool data dashboards that connect directly to your data sources — live, real-time, and interactive. Filter by date range, department, region, or any dimension that matters to your business. Drill down from summary to detail in one click. No more waiting for weekly reports or asking engineering for a custom query.
Built in Retool for fast delivery and easy maintenance — your team can update filters and views without developer help.
Live data, not static reports. Your dashboard connects directly to your database or API — every chart updates in real time as your data changes.
Interactive filters your team controls. Date range pickers, dropdown filters, search bars — your team can slice the data themselves without asking for a new report.
Built for decisions, not decoration. I design around your actual KPIs — revenue, pipeline, support volume, operational throughput — not generic chart templates.
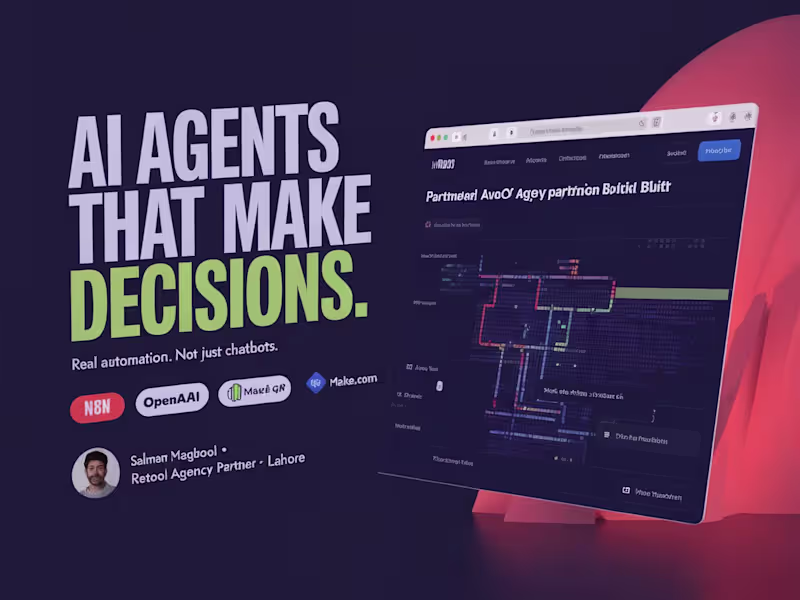
AI-powered summaries optional. For complex datasets, I can add GPT-powered natural language summaries that explain what the data means, not just what it shows.
What's included
KPI mapping and dashboard design
I identify your key metrics, data sources, and decision-making needs — then design the dashboard layout before building. You approve the blueprint first.
Retool build and data connection
Full dashboard built in Retool — charts, KPI cards, tables, filters, and drill-downs. Connected to your live data sources and tested with real data.
Training and handoff
30-minute walkthrough of how to use the dashboard, add new filters, and interpret the visualizations. Written documentation included.
FAQs
Example work
Salman 's other services
Starting at$1,599
Duration1 week
Tags
Firebase
Google AI Studio
Google Sheets
OpenAI
Retool
Supabase
AI Engineer
Data Analyst
Low-Code/No-Code Developer
Service provided by
Salman Maqbool Lahore, Pakistan
- $1k+
- Earned
- 1
- Paid projects
- 5.00
- Rating
- 56
- Followers
Retool Data Visualization DashboardSalman Maqbool
Starting at$1,599
Duration1 week
Tags
Firebase
Google AI Studio
Google Sheets
OpenAI
Retool
Supabase
AI Engineer
Data Analyst
Low-Code/No-Code Developer
Your data is in PostgreSQL, Airtable, Google Sheets, or an API — but your team is making decisions from raw tables and messy exports. A proper data visualization dashboard turns that raw data into clear, interactive charts, KPI cards, and trend reports your leadership can actually use.
I build Retool data dashboards that connect directly to your data sources — live, real-time, and interactive. Filter by date range, department, region, or any dimension that matters to your business. Drill down from summary to detail in one click. No more waiting for weekly reports or asking engineering for a custom query.
Built in Retool for fast delivery and easy maintenance — your team can update filters and views without developer help.
Live data, not static reports. Your dashboard connects directly to your database or API — every chart updates in real time as your data changes.
Interactive filters your team controls. Date range pickers, dropdown filters, search bars — your team can slice the data themselves without asking for a new report.
Built for decisions, not decoration. I design around your actual KPIs — revenue, pipeline, support volume, operational throughput — not generic chart templates.
AI-powered summaries optional. For complex datasets, I can add GPT-powered natural language summaries that explain what the data means, not just what it shows.
What's included
KPI mapping and dashboard design
I identify your key metrics, data sources, and decision-making needs — then design the dashboard layout before building. You approve the blueprint first.
Retool build and data connection
Full dashboard built in Retool — charts, KPI cards, tables, filters, and drill-downs. Connected to your live data sources and tested with real data.
Training and handoff
30-minute walkthrough of how to use the dashboard, add new filters, and interpret the visualizations. Written documentation included.
FAQs
Example work
Salman 's other services
$1,599