
I build clear to understand data visualizations and dashboards.Bisrat Addisu
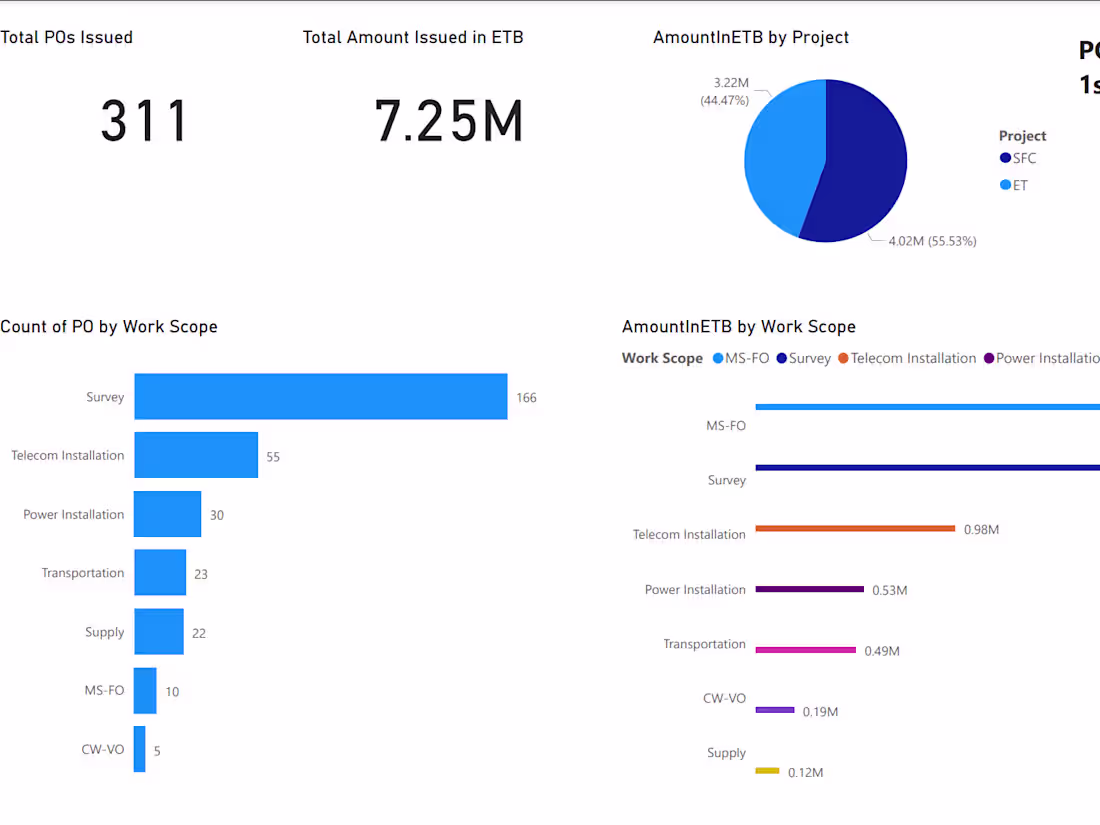
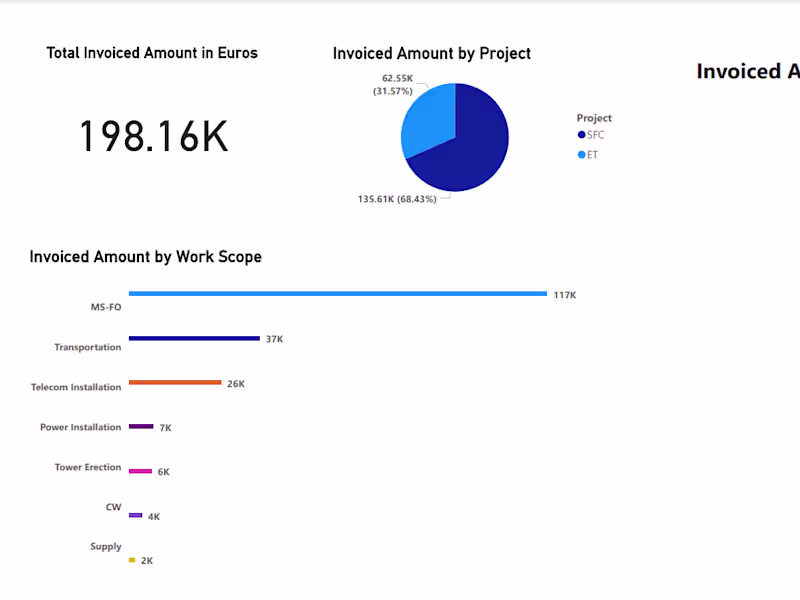
Visualize Your Data with Enchanting Dashboards. Create charts and graphs that tell compelling data stories, transforming raw numbers into visual masterpieces. Craft visually stunning and interactive Power BI dashboards that captivate your audience
What's included
Make Your Data the Star of the Show
Create charts and graphs that tell compelling data stories, transforming raw numbers into visual masterpieces.
Bisrat's other services
Starting at$150
Duration1 week
Tags
Tableau
Data Analyst
Data Visualizer
Product Data Analyst
Service provided by
Bisrat Addisu Addis Ababa, Ethiopia
I build clear to understand data visualizations and dashboards.Bisrat Addisu
Starting at$150
Duration1 week
Tags
Tableau
Data Analyst
Data Visualizer
Product Data Analyst
Visualize Your Data with Enchanting Dashboards. Create charts and graphs that tell compelling data stories, transforming raw numbers into visual masterpieces. Craft visually stunning and interactive Power BI dashboards that captivate your audience
What's included
Make Your Data the Star of the Show
Create charts and graphs that tell compelling data stories, transforming raw numbers into visual masterpieces.
Bisrat's other services
$150