
Data AnalystFaith Kinyoo
I offer customized dashboards and data visuals that transform complex data into actionable insights, enabling businesses to make informed decisions efficiently. The dashboards provide real-time, intuitive metrics, while our engaging data visuals highlight trends and patterns with clarity and precision. What sets us apart is our focus on tailoring solutions to your specific goals, ensuring a seamless blend of functionality and impactful design.
What's included
Dashboard
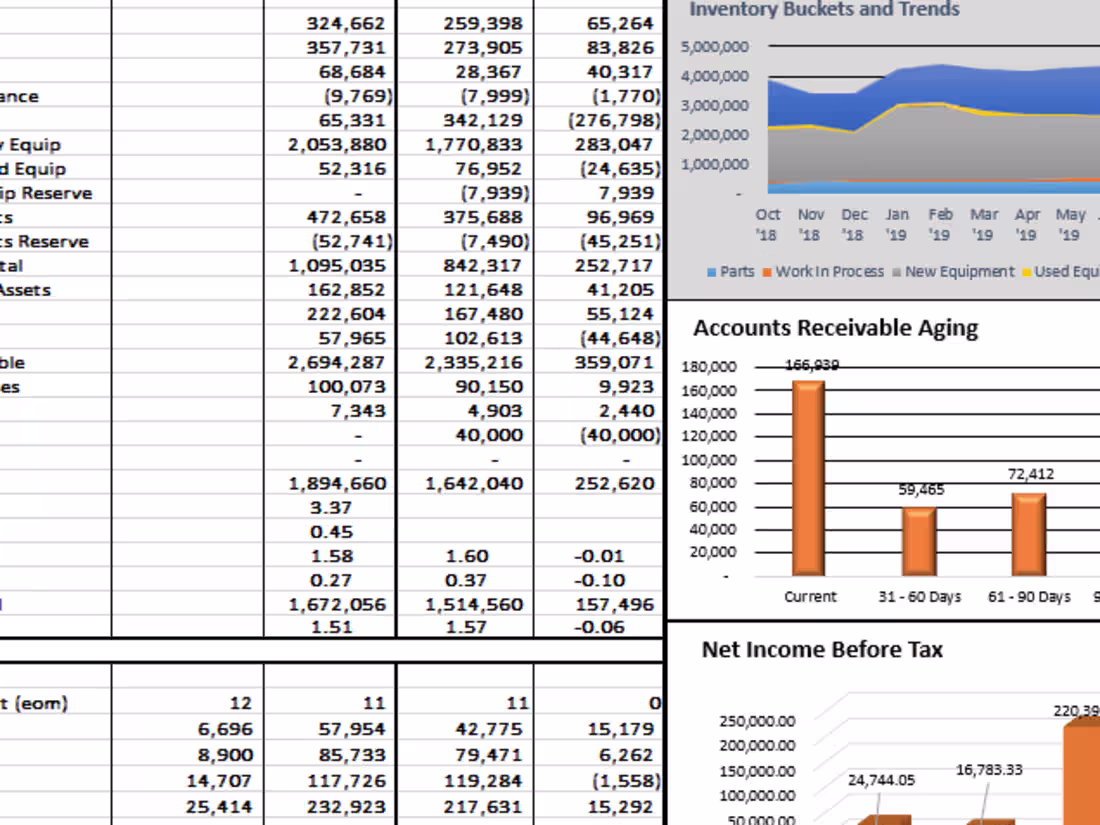
I will provide actionable insights, visualizing key metrics from their data analysis. Expect intuitive charts, trends, and performance indicators tailored to their goals. The dashboard simplifies complex data into easy-to-understand summaries, enabling informed decisions and tracking progress efficiently in real-time. Custom filters enhance data exploration
Data Visuals
A clear, engaging representations of their data, including charts, graphs, and heatmaps. These visuals highlight patterns, trends, and correlations, transforming raw data into actionable insights. Designed for clarity and impact, they simplify complex information, enabling quicker understanding and informed decision-making with visually compelling narratives.
Faith's other services

Contact for pricing
Tags
Google Analytics
Microsoft Excel
Microsoft Power BI
Microsoft Teams
Tableau
Data Analyst
Database Specialist
Data Visualizer
Service provided by
Faith Kinyoo Nairobi, Kenya
Data AnalystFaith Kinyoo
Contact for pricing
Tags
Google Analytics
Microsoft Excel
Microsoft Power BI
Microsoft Teams
Tableau
Data Analyst
Database Specialist
Data Visualizer
I offer customized dashboards and data visuals that transform complex data into actionable insights, enabling businesses to make informed decisions efficiently. The dashboards provide real-time, intuitive metrics, while our engaging data visuals highlight trends and patterns with clarity and precision. What sets us apart is our focus on tailoring solutions to your specific goals, ensuring a seamless blend of functionality and impactful design.
What's included
Dashboard
I will provide actionable insights, visualizing key metrics from their data analysis. Expect intuitive charts, trends, and performance indicators tailored to their goals. The dashboard simplifies complex data into easy-to-understand summaries, enabling informed decisions and tracking progress efficiently in real-time. Custom filters enhance data exploration
Data Visuals
A clear, engaging representations of their data, including charts, graphs, and heatmaps. These visuals highlight patterns, trends, and correlations, transforming raw data into actionable insights. Designed for clarity and impact, they simplify complex information, enabling quicker understanding and informed decision-making with visually compelling narratives.
Faith's other services
Contact for pricing