
Interactive Business Dashboards with Power BIShadia Afrin Lima
I offer professional data analysis services, specializing in creating interactive Power BI dashboards that transform raw data into actionable insights. With expertise in Python, SQL, Excel, and Power BI, I deliver customized solutions that help businesses visualize performance and make data-driven decisions. My unique value lies in my ability to combine technical proficiency with a deep understanding of business needs, ensuring insightful and impactful results tailored to each client.
What's included
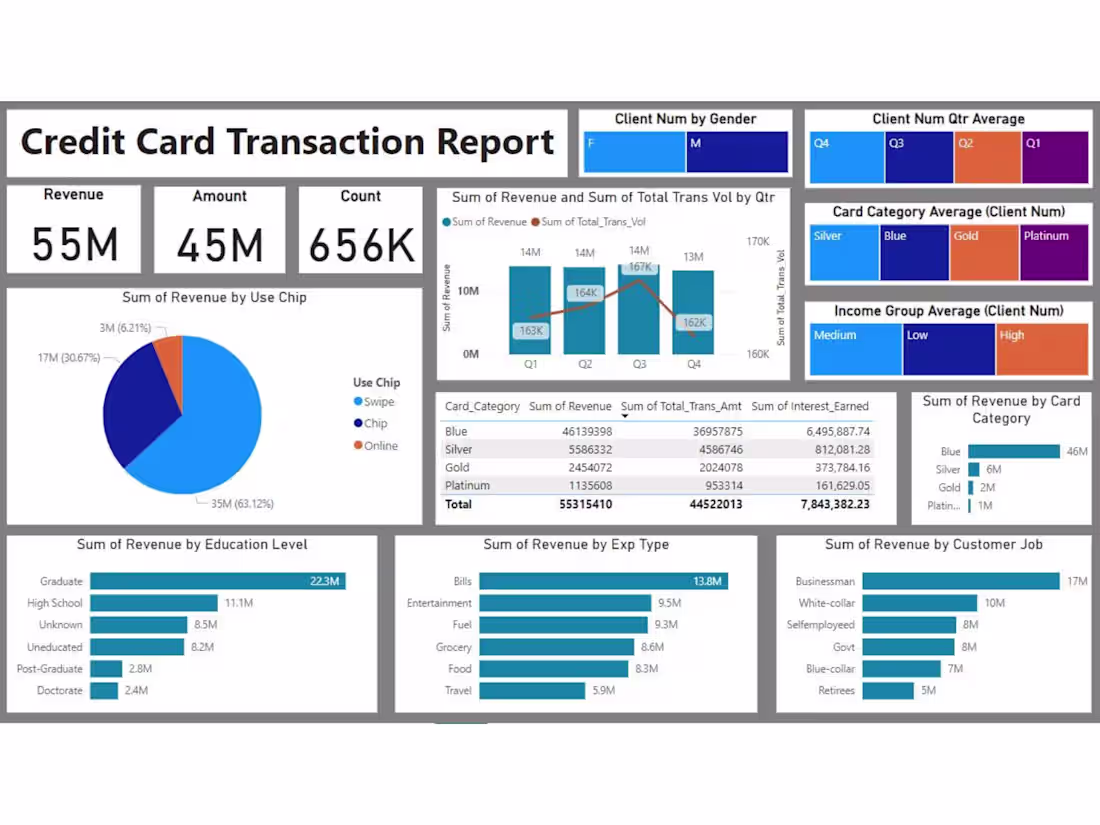
Interactive Business Dashboards with Power BI
1. Interactive Power BI Dashboard:
-Fully functional and user-friendly dashboards according to business needs.
-Dynamic visuals, including charts, graphs, and tables, showcasing key metrics.
-Drill-through functionality for in-depth analysis.
-Slicers and filters to enable customized views of the data.
2. Data Preparation and Integration
-Data cleaning, transformation, and modeling to ensure accuracy and usability.
-Integration of data from multiple sources (e.g., Excel, SQL databases, APIs).
-Well-organized data relationships and models within Power BI.
3. Performance Metrics and KPIs
-Visualizations highlighting critical KPIs (Key Performance Indicators).
-Metrics customized for business domains (e.g., sales trends, customer insights, operational efficiency).
4. Power BI File (.pbix)
-The Power BI project file that includes all the visuals, data models, and settings.
5. Dashboard Usage Guide
-A written or video guide explaining how to use, update, and interact with the dashboard.
-Tips for applying filters, updating data sources, and exporting reports.
6. Data Insights and Recommendations
-A brief report summarizing key insights derived from the dashboard.
-Actionable recommendations based on the analysis.
7. Ongoing Support
-Post-delivery support for a specified time period to resolve issues or make minor adjustments.
Shadia's other services
Contact for pricing
Tags
Microsoft Excel
Microsoft Power BI
pandas
Python
SQL
Data Analyst
Data Modelling Analyst
Data Visualizer
Service provided by
Shadia Afrin Lima Meherpur, Bangladesh
Interactive Business Dashboards with Power BIShadia Afrin Lima
Contact for pricing
Tags
Microsoft Excel
Microsoft Power BI
pandas
Python
SQL
Data Analyst
Data Modelling Analyst
Data Visualizer
I offer professional data analysis services, specializing in creating interactive Power BI dashboards that transform raw data into actionable insights. With expertise in Python, SQL, Excel, and Power BI, I deliver customized solutions that help businesses visualize performance and make data-driven decisions. My unique value lies in my ability to combine technical proficiency with a deep understanding of business needs, ensuring insightful and impactful results tailored to each client.
What's included
Interactive Business Dashboards with Power BI
1. Interactive Power BI Dashboard:
-Fully functional and user-friendly dashboards according to business needs.
-Dynamic visuals, including charts, graphs, and tables, showcasing key metrics.
-Drill-through functionality for in-depth analysis.
-Slicers and filters to enable customized views of the data.
2. Data Preparation and Integration
-Data cleaning, transformation, and modeling to ensure accuracy and usability.
-Integration of data from multiple sources (e.g., Excel, SQL databases, APIs).
-Well-organized data relationships and models within Power BI.
3. Performance Metrics and KPIs
-Visualizations highlighting critical KPIs (Key Performance Indicators).
-Metrics customized for business domains (e.g., sales trends, customer insights, operational efficiency).
4. Power BI File (.pbix)
-The Power BI project file that includes all the visuals, data models, and settings.
5. Dashboard Usage Guide
-A written or video guide explaining how to use, update, and interact with the dashboard.
-Tips for applying filters, updating data sources, and exporting reports.
6. Data Insights and Recommendations
-A brief report summarizing key insights derived from the dashboard.
-Actionable recommendations based on the analysis.
7. Ongoing Support
-Post-delivery support for a specified time period to resolve issues or make minor adjustments.
Shadia's other services
Contact for pricing