
Monitoring and LoggingAigini Navaneethan
Experienced in providing monitoring services using tools like Zabbix, Nagios, and New Relic, with a strong ability to customize solutions based on customer requirements for optimal system performance and reliability. Skilled in setting up alerts, dashboards, and proactive monitoring to ensure minimal downtime and quick issue resolution. Currently expanding expertise in log management and analysis, adapting to customer needs for improved observability and troubleshooting. Committed to enhancing monitoring strategies and optimizing system performance through tailored solutions.
What's included
Implementation of Monitoring Solutions
Deploy and configure Zabbix, Nagios, and New Relic for system, application, and infrastructure monitoring; Set up custom monitoring dashboards to visualize key metrics such as CPU, memory, disk usage, and network performance; Define and configure threshold-based alerts to proactively detect performance issues and failures.
Customization of Monitoring Solutions Based on Customer Needs
Develop and integrate custom plugins, scripts, and APIs to extend monitoring capabilities; Configure custom alerts, notifications, and escalations to align with business and operational requirements; Implement multi-layer monitoring (infrastructure, application, and service-level monitoring) tailored to specific customer needs.
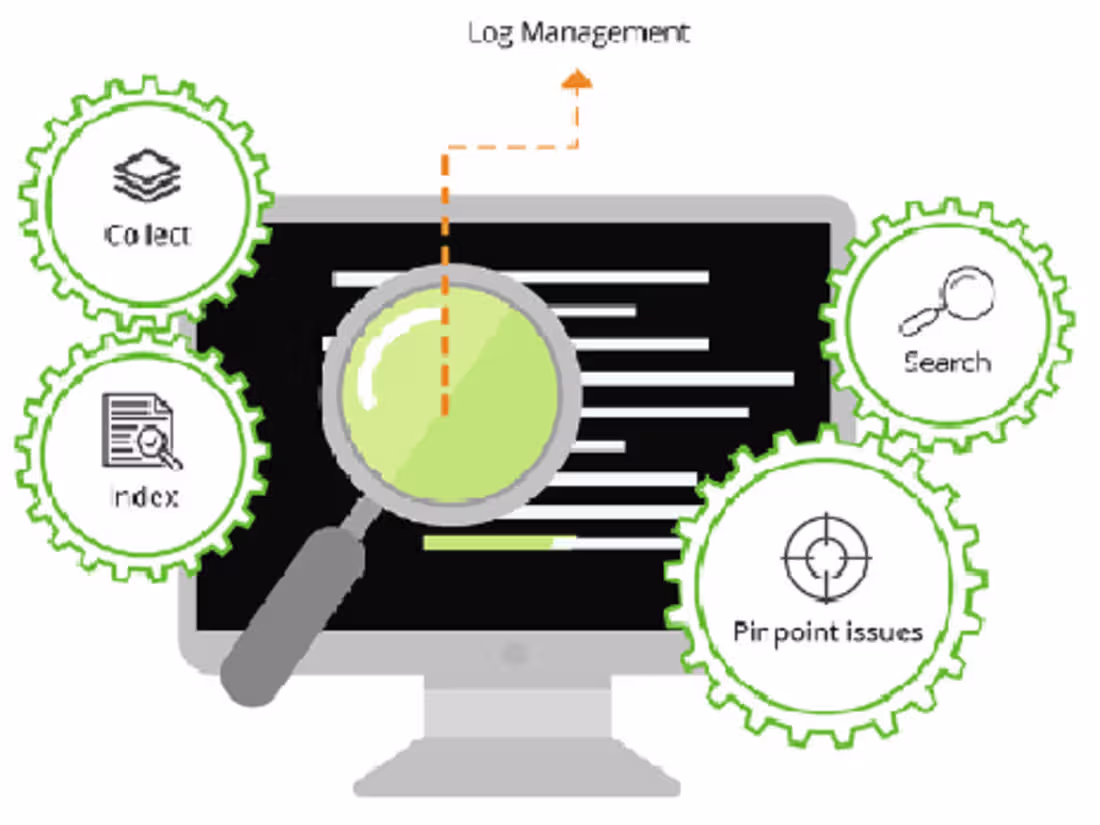
Log Management and Centralized Logging
Learning how to configure and maintain centralized log management solutions using tools like ELK (Elasticsearch, Logstash, Kibana), Loki, or Fluentd; Collect, parse, and analyze logs from servers, applications, network devices, and cloud services; Implement log retention policies, archival strategies, and access controls to ensure compliance with security standards.
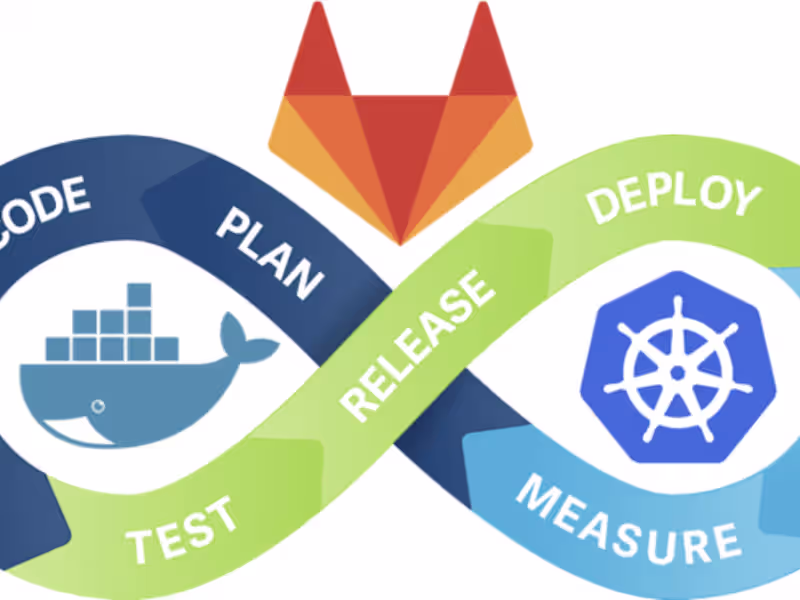
Integration with Cloud and DevOps Pipelines
Integrate monitoring and logging tools with AWS CloudWatch, Azure Monitor, and Kubernetes (Prometheus, Grafana); Enable real-time log streaming and analytics for cloud-native and containerized applications; Automate monitoring deployment using Terraform, Ansible, or Helm charts for consistency across environments.
Performance Tuning & Optimization
Analyze system and application logs to identify performance bottlenecks and optimize resource usage; Implement predictive analytics and anomaly detection to prevent potential failures before they impact operations; Utilize New Relic APM, Zabbix trends, or Nagios plugins to fine-tune application performance monitoring.
Incident Response and Root Cause Analysis
Develop and maintain incident response workflows based on monitoring alerts and log analysis; Conduct post-incident reviews and root cause analysis (RCA) to prevent future occurrences; Implement automated remediation actions using self-healing scripts or AI-driven monitoring tools.

Contact for pricing
Tags
Nagios
New Relic
Zabbix
Systems Engineer
Service provided by
Aigini Navaneethan proKuala Lumpur, Malaysia
Monitoring and LoggingAigini Navaneethan
Contact for pricing
Tags
Nagios
New Relic
Zabbix
Systems Engineer
Experienced in providing monitoring services using tools like Zabbix, Nagios, and New Relic, with a strong ability to customize solutions based on customer requirements for optimal system performance and reliability. Skilled in setting up alerts, dashboards, and proactive monitoring to ensure minimal downtime and quick issue resolution. Currently expanding expertise in log management and analysis, adapting to customer needs for improved observability and troubleshooting. Committed to enhancing monitoring strategies and optimizing system performance through tailored solutions.
What's included
Implementation of Monitoring Solutions
Deploy and configure Zabbix, Nagios, and New Relic for system, application, and infrastructure monitoring; Set up custom monitoring dashboards to visualize key metrics such as CPU, memory, disk usage, and network performance; Define and configure threshold-based alerts to proactively detect performance issues and failures.
Customization of Monitoring Solutions Based on Customer Needs
Develop and integrate custom plugins, scripts, and APIs to extend monitoring capabilities; Configure custom alerts, notifications, and escalations to align with business and operational requirements; Implement multi-layer monitoring (infrastructure, application, and service-level monitoring) tailored to specific customer needs.
Log Management and Centralized Logging
Learning how to configure and maintain centralized log management solutions using tools like ELK (Elasticsearch, Logstash, Kibana), Loki, or Fluentd; Collect, parse, and analyze logs from servers, applications, network devices, and cloud services; Implement log retention policies, archival strategies, and access controls to ensure compliance with security standards.
Integration with Cloud and DevOps Pipelines
Integrate monitoring and logging tools with AWS CloudWatch, Azure Monitor, and Kubernetes (Prometheus, Grafana); Enable real-time log streaming and analytics for cloud-native and containerized applications; Automate monitoring deployment using Terraform, Ansible, or Helm charts for consistency across environments.
Performance Tuning & Optimization
Analyze system and application logs to identify performance bottlenecks and optimize resource usage; Implement predictive analytics and anomaly detection to prevent potential failures before they impact operations; Utilize New Relic APM, Zabbix trends, or Nagios plugins to fine-tune application performance monitoring.
Incident Response and Root Cause Analysis
Develop and maintain incident response workflows based on monitoring alerts and log analysis; Conduct post-incident reviews and root cause analysis (RCA) to prevent future occurrences; Implement automated remediation actions using self-healing scripts or AI-driven monitoring tools.
Contact for pricing